The COLUMNS function in Excel allows us to determine the total number of columns in a given cell range or array. It is a simple and straightforward function that is incredibly useful when dealing with large amounts of data.
The COLUMNS function can also be used to set up data validations and, when combined with other Excel functions, result in more complex formulas.

Syntax
The syntax of the COLUMNS function is as follows.
=COLUMNS(array)The COLUMNS function accepts only one argument:
Arguments:
'array' – This is a required argument that accepts the array, cell reference, or range of cells for which we want to count the number of columns. The input value can also be a formula returning the array for which total columns are to be calculated.
Important Characteristics of the COLUMNS Function
Some of the noteworthy features of the COLUMNS function are as follows.
- The input value of the array argument can also be an array constant.
- If the value of the array argument is set to 0, the COLUMNS function returns 1.
Examples of COLUMNS Function
To begin with, we have taken various kinds of input values for the array argument to understand the basic functionality of the COLUMNS function.
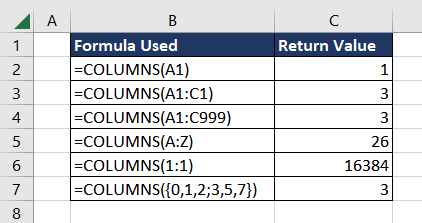
In the first example, the value of the array argument is a single cell reference A1, to which the function returns the number of columns included which is 1.
The next instance counts the total columns in the range A1:C1, which results in 3 indicating columns A, B, and C. The third example highlights a similar scenario where even if the range changes to A1:C999, the number of columns remain the same.
The subsequent example shows that the cell range includes all columns from A to Z and therefore the COLUMNS function returns 26 indicating the total number of columns.
The following example is a neat trick to calculate the total number of columns in the worksheet. The formula calculates the number of columns in the range that includes all cells in the first row of the worksheet and therefore results in the total columns in Excel which are 16384.
The last example shows how array constants can be passed to the COLUMNS function. In the example, we have supplied an array with two rows and three columns to the COLUMNS function. The function results in 3, depicting the number of columns in the supplied array.
Now that the basic functionality of the COLUMNS function is clear, let's move on to some practical applications of the said function.
Example 1 – Calculating Average Using COLUMNS Function
Suppose we have a dataset that contains everyday sales for 7 different sales regions. We now wish to find the average sales for each day.
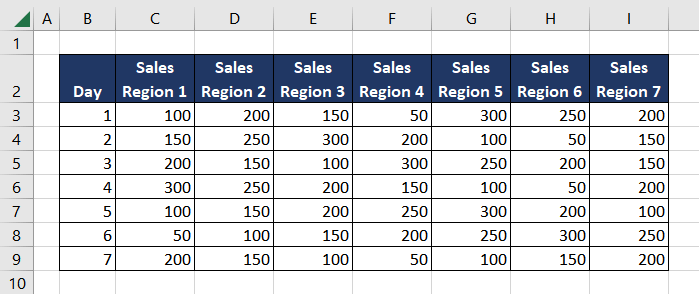
The easiest way is to use the AVERAGE function in Excel directly. Here, we will use a combination of SUM and COLUMNS functions to explore another way to achieve the required result.
The SUM function will add up all the sales values for the day and the COLUMNS function will count the total number of columns which is the number of days in this case. We will then divide the sum by the number of columns which will give us the average value of all the data points in the range. The formula used will be as follows.
=SUM(C3:I3)/COLUMNS(C3:I3)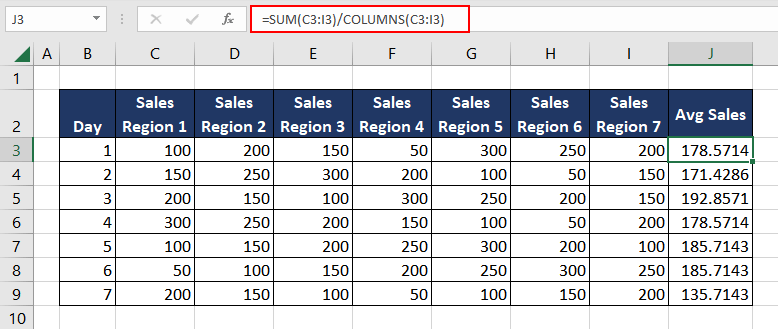
Using the COLUMNS function, we can easily calculate the total number of columns in the given range but what if the requirement is to calculate the total number of cells in the range? Let's explore how to do this in the next example.
Example 2 – Finding Total Cells in Range Using COLUMNS Function
Suppose we have an ongoing dataset of a company that consists of 3 sales regions and each region is hiring new salespeople with the condition that the total salesperson in each region remains the same. We now wish to calculate the total number of salespersons as per the last updated data.
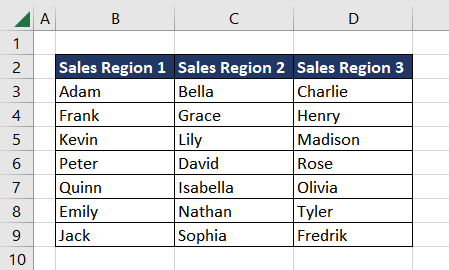
To calculate the total number of salespeople in the company, we can count the total number of cells in the range using the COLUMNS function together with the ROWS function. In this case, the logic used will be:
Total number of salespeople = Number of regions * Number of salespeople per regionThe number of regions can be calculated using the COLUMNS function, as each column represents a sales region in the dataset. We can use the following formula to count the number of columns in the range.
=COLUMNS(B3:D9)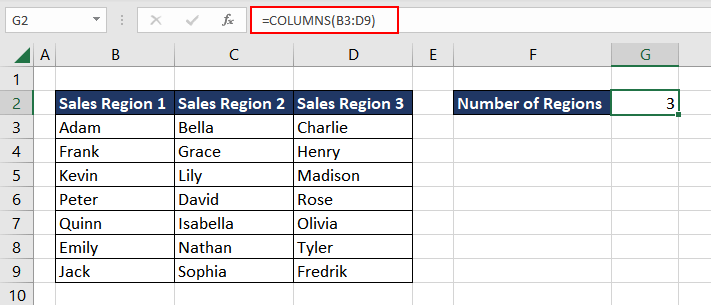
The number of salespeople per region can be calculated using the ROWS function, as each row represents a salesperson in the dataset. The formula used will be as follows.
=ROWS(B3:D9)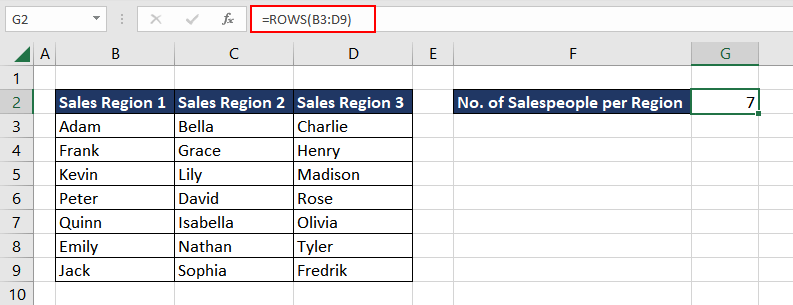
To determine the total number of cells or total salespersons in the company, we can use the following formula:
=COLUMNS(B3:D9)*ROWS(B3:D9)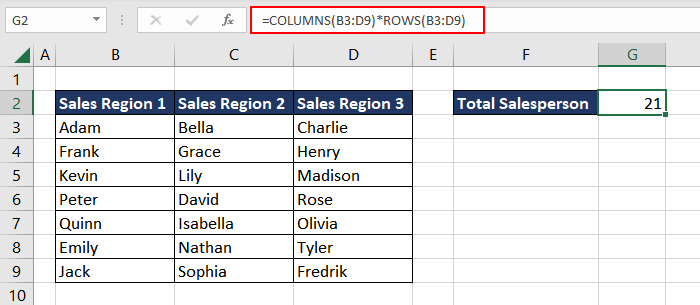
Example 3 – Getting Number Sequence in Column
In this example, suppose we wish to create a series of dates with an increment of 3 days. One simple and quick method is to use the AutoFill feature in Excel. First, enter the starting date in a cell and then add the next date as per the increment in the subsequent cell. Now, select the two cells together until the cursor changes to a plus sign (+) in the bottom right corner of the cell. We can now drag the cursor across the columns as per our requirement.
Another way to do the same is by combining the COLUMNS function with the DATE function. The DATE function is used to specify the starting date of the series, while the COLUMNS function is used to create a sequence with an increment of 3. The formula to set the starting date is as follows.
=DATE(2023,1,1)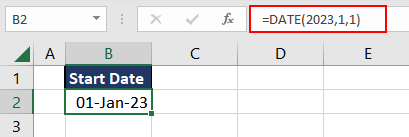
Now, to create a series of dates, the trick is to calculate the number of columns between an absolute cell reference and the current cell reference. The formula used will be as follows.
=COLUMNS($B$2:B2)Here, the number of columns between the given range is 1. As the formula is copied to subsequent cells in the range, the cell reference changes while the starting cell reference B2 remains the same.

As we can see, when the formula was copied to cell C2, the above formula changed the cell range to $B$2:C2, and so on. As we want an increment of 3 days, we can add it as a multiple and add -1 to adjust the first return value. The formula will be as follows.
=DATE(2023,1,1)+(COLUMNS($B$2:B2)-1)*3Without the -1, the first date in the series would also be incremented by the 3 days disrupting the starting date of the series.

This way we can easily create a series or sequence using the COLUMNS function.
Example 4 – Using Data Validation with COLUMNS Function
Another interesting use of the COLUMNS function is when dealing with user-generated content. We can restrict the total columns in a dataset using Data Validation. For instance, let's say we have an office team event coming up, and employees are allowed to create their teams. However, we want to restrict the number of team members to a maximum of 4 per team.
To enforce this restriction, we can use Data Validation in Excel along with the COLUMNS function to limit the number of team members that a user can enter. Let's understand how to do so in a step-by-step manner.
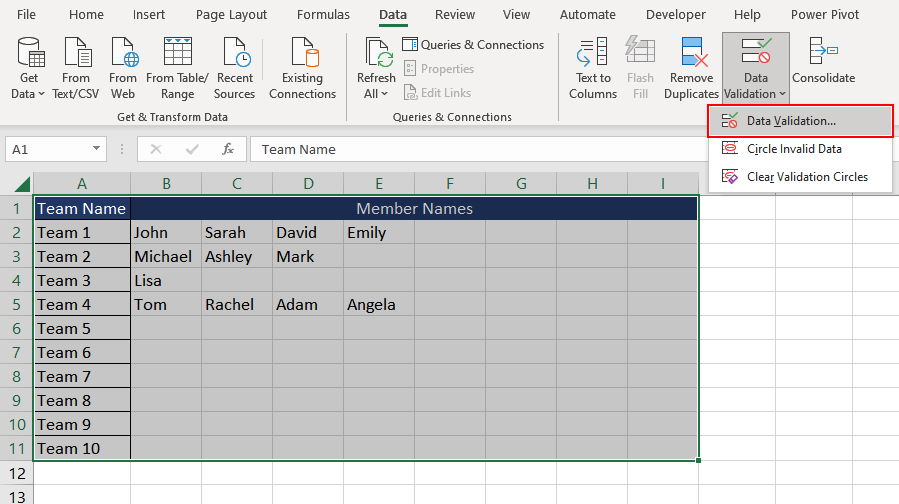
Start by selecting the cell range that we wish to restrict. Then, go to the Data tab and click on the Data Validation option in the Data Tools section.
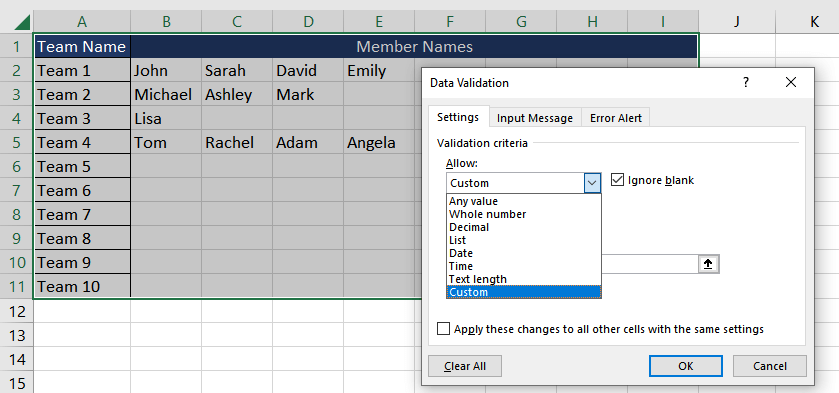
After choosing the Data validation option, a dialog box will appear. Then, select Custom from the Allow drop-down menu in the Validation criteria.
The next step is to enter the COLUMNS function in the Formula field. The formula used will be as follows.
=COLUMNS($B1:$I1)<=4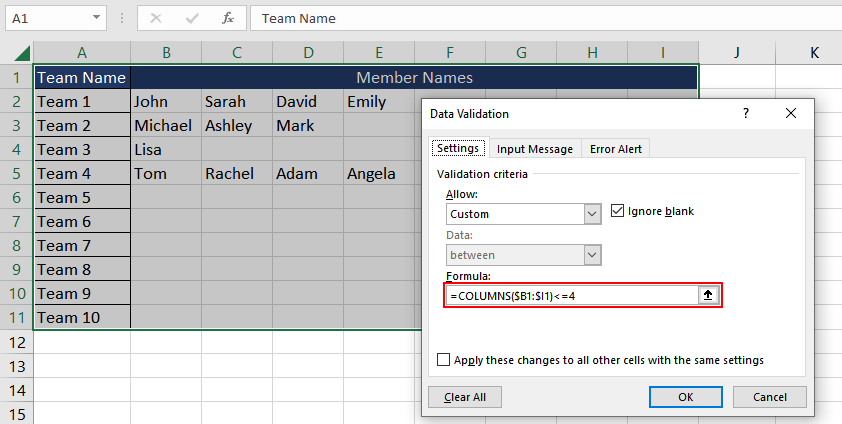
This formula will check if the number of columns between columns B and I is less than or equal to 4, which means that no more than 4 team members can be entered for each team.
To improve the user experience, we can also set up a custom error message. Choose the Error Alert tab in the Data Validation dialog box and enter an error message such as "There can only be up to 4 team members per team" and click OK.
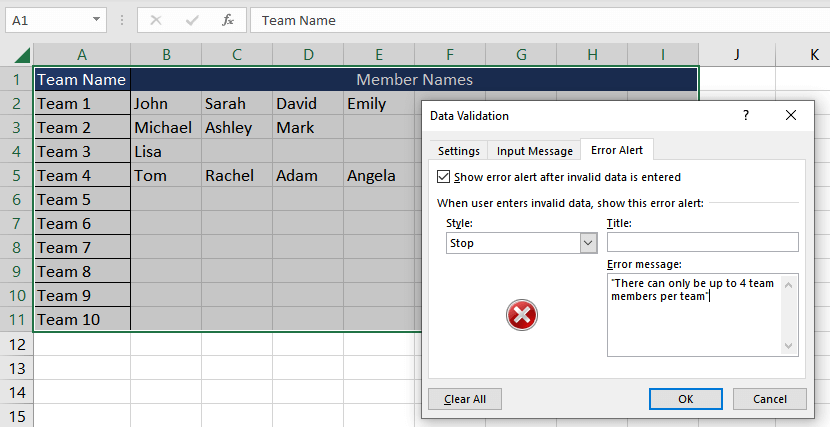
If we try to add another name in cell F5 where Team 4 already has 4 members, we will get an the error message.
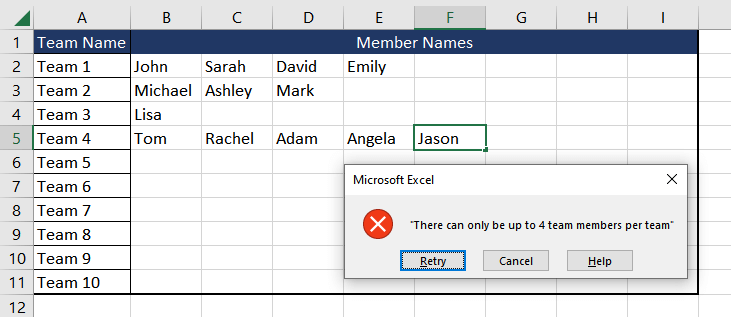
Now if any user tries to enter more than 4 team members for any team, they will see an error message and will not be able to enter the data until they correct the error. This helps ensure that each team has no more than 4 members, which is the limit set by the Data Validation rule.
COLUMNS Function vs ROWS Function
Now we know that the COLUMNS function returns the number of columns in a given range or array. In contrast, the ROWS function counts the total rows in a given range or array. Let's understand the difference between the two as they both can be valuable when working with bigger datasets.
Here, we have a sample dataset of random numbers where we are calculating the total number of columns and rows.
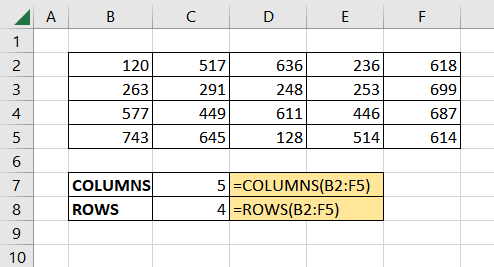
As we can see, the COLUMNS function calculated the total number of columns in the range B2:F5 which is 5, while the ROWS function counted the rows which are 4.
COLUMNS Function vs COLUMN Function
Both COLUMNS and COLUMN functions are used to work with columns of data, but they return different values. The COLUMNS function counts the total number of columns in an array while the COLUMN function returns the column number of a specific cell. Let's understand it using an example.
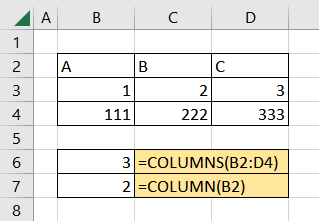
In the first case, the COLUMNS function counts the total columns in the range B2:D4 which consists of three columns and hence the return value. In the next case, the COLUMN function returns the column number of cell B2 which is 2. Both functions are useful when you want to perform calculations on specific columns or sets of data within a worksheet.
Practice with different datasets and scenarios to explore more applications of the COLUMNS function and add to your Excel expertise. In the meantime, we will introduce you to other Excel functions that can help improve your productivity and efficiency.


