The ROWS function counts the total number of rows in a given cell range or an array. The function is highly helpful when dealing with large datasets and enables better data analysis.
The ROWS function also includes blank rows when calculating the total number of rows.

Syntax
The syntax of the ROWS function is as follows.
=ROWS(array)The ROWS function is pretty straightforward and only accepts one argument.
Arguments:
'array' – It is a mandatory argument that includes the range of cells or arrays for which we want to count the number of rows. The value of the array argument can also be a cell reference.
Important Characteristics of the ROWS Function
Some of the noteworthy features of the ROWS function are as follows.
- The input value of the array argument can also be an array constant.
- When the value of the array argument is set to 0, the ROWS function returns 1.
Examples of ROWS Function
To begin with, we have taken different input values for the array argument of the ROWS function to understand its usage better.
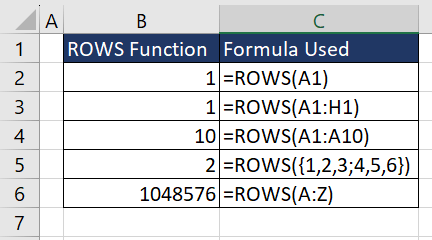
In the first example, the input value is a cell reference A1 which covers one row; therefore, the return value is 1. In the next example, the input value contains the cell range A1:H1 which covers 1 row but several columns. As we can see, the return value is 1.
The third example counts the total rows in the given cell range A1:A10. The subsequent example shows that the ROWS function also accepts a static array as the input value of the array argument and returns the total rows involved.
The last example counts the total number of rows in a range of cells from column A to column Z which is the total rows in Excel.
Now that we have a clear understanding of the fundamental functionality of the ROWS function, let's explore more applications to enhance its usefulness.
Example 1 – Simple Use of ROWS Function
Suppose there is an upcoming online event and we sent out the sign-up form for the same. Each time an attendee fills out the form, the details automatically get added to a worksheet. We now have the dataset of complete information about the attendees.
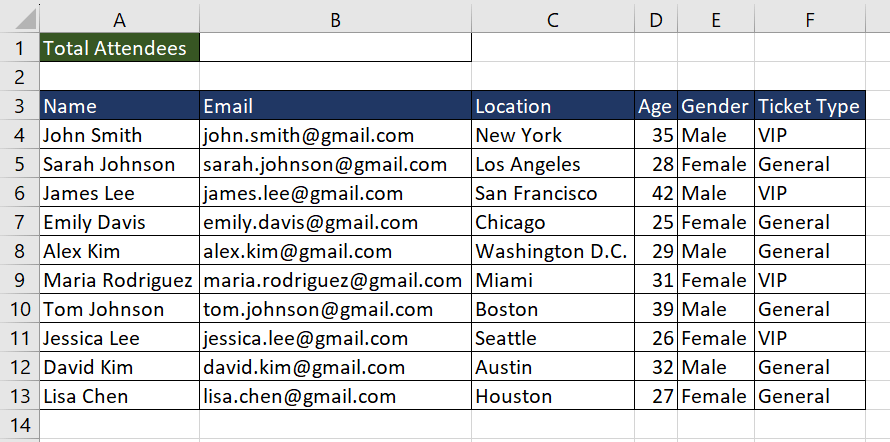
As each row represents an attendee, we can easily calculate the total attendees using the ROWS function. The formula used will be as follows.
=ROWS(A4:F13)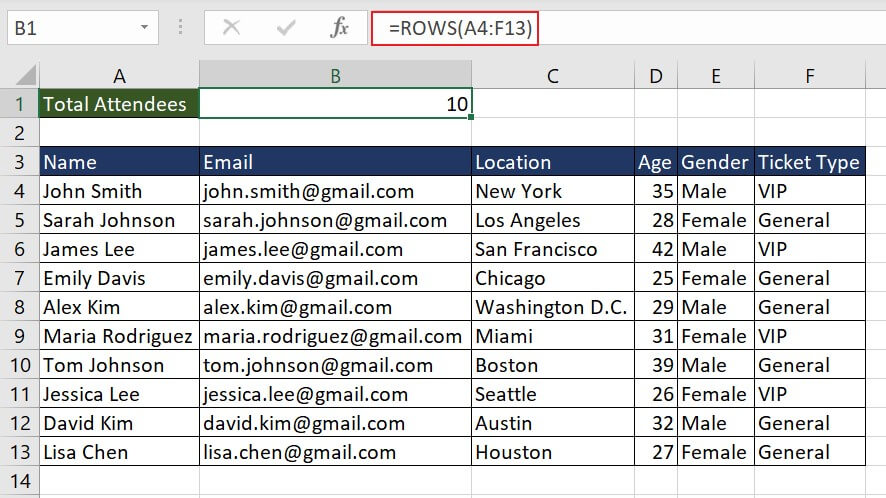
This is a simple and straightforward application of the ROWS function. When combined with other Excel functions, we will be able to solve some more complex problems. Let's explore the utility of the function further with the examples mentioned below.
Example 2 – Extracting Value from Last Row Using ROWS Function
Suppose we have an online mobile phone shop where new models are added frequently. In our dataset, whenever a new model is launched, it gets added in a new row along with the date and corresponding details. If we wish to inform our customers about the newest model, we can simply extract the details added in the last row.
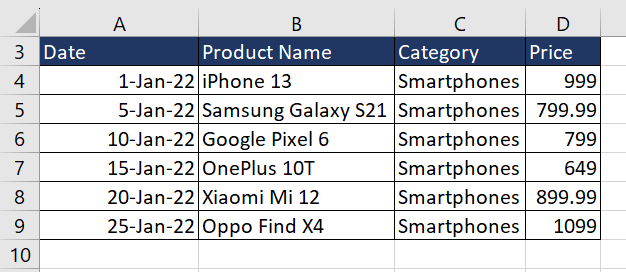
Using a combination of ROWS and INDEX functions, we can easily extract the value in the last row of the dataset. The INDEX function is used to return a specific value from a range of cells, and by using the ROWS function, we can obtain the total number of rows in the dataset. We can then use this value with the INDEX function to retrieve the data from the last row since the total number of rows ultimately points to the last row number.
The formula used to get the total rows is as follows.
=ROWS(A3:D9)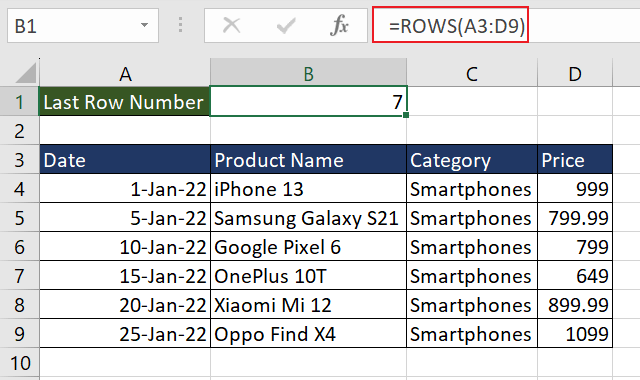
Now that we have the total rows, which is also the last row number of the dataset, we can use the INDEX function. The return value of the ROWS function indicates the row number, and the column number will be 2 as we wish to extract the 'Product Name'. The formula used will be as follows.
=INDEX(A3:D9,ROWS(A3:D9),2)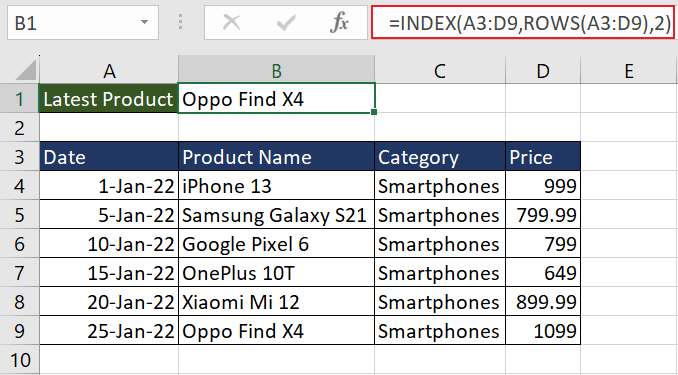
By adjusting the cell range, we can now extract the value from the last row. But what if we wish to find the last row number in a dataset?
Example 3 – Locating Last Row in Range Using ROWS Function
Here we have an Excel dataset of personal daily expenses. We update the sheet at the end of each day to keep track of household expenses. For instance, if we wish to calculate the total expenses for the last few days, we can manually scroll down to the last row and then select the rows from the bottom.
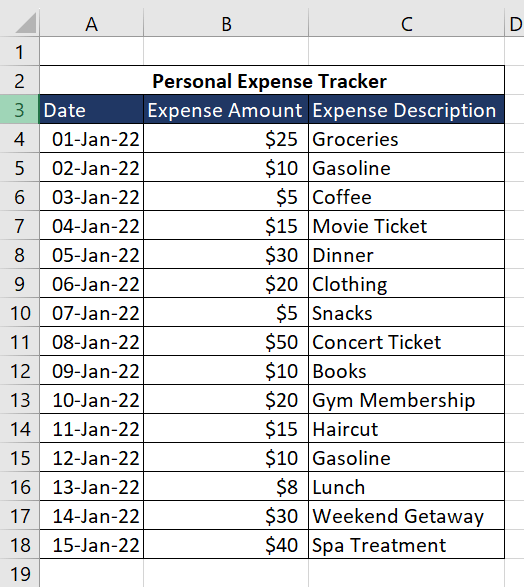
The more efficient way is to use the ROWS function to find out the last row in the range and then use that information further. We will first find the first row in the range using the ROW and MIN functions. We will then add the total number of rows in the range and lastly adjust the value by subtracting 1.
The foremost part is to find the first row number. The formula used will be as follows.
=ROWS(A4:C18)This will return an array of row numbers in the given dataset.
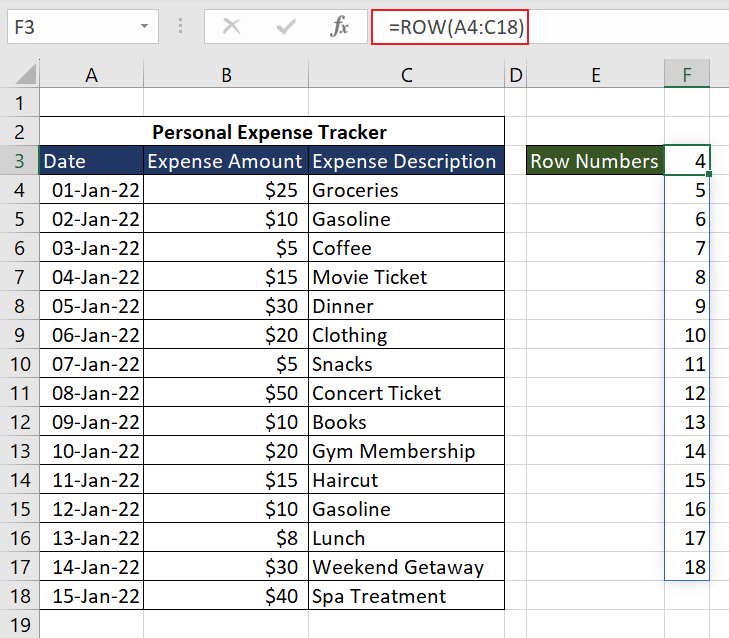
Now we can simply use the MIN function and get the first row number. The updated formula will be as follows.
=MIN(ROW(A4:C18))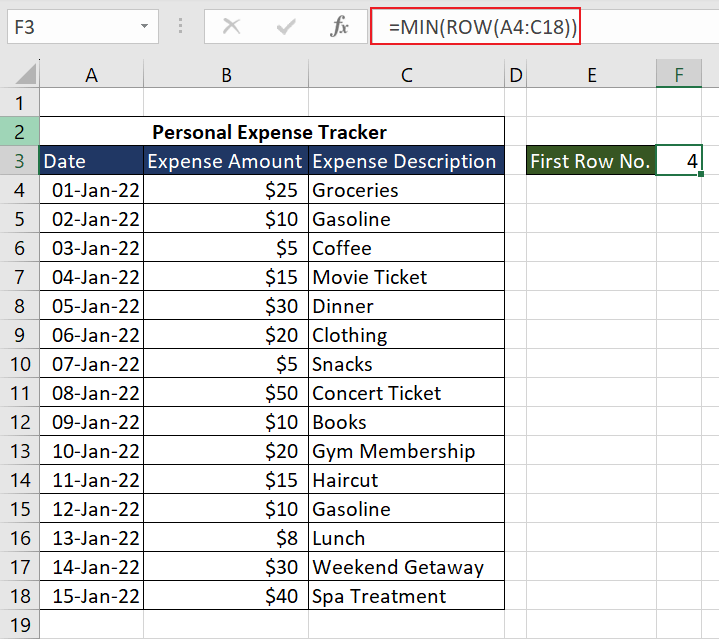
Now, to get the total number of rows in the range of cells, the formula used will be as follows.
=ROWS(A4:C18)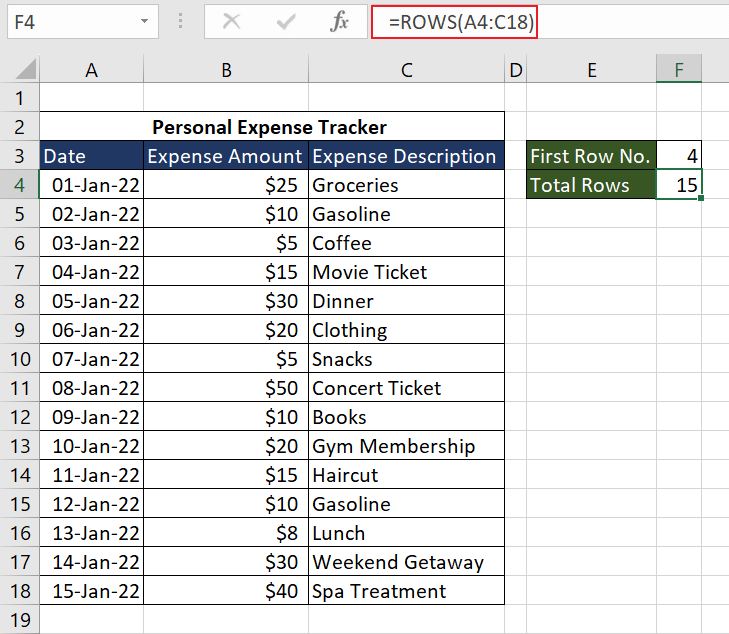
Now, the final formula which adds the first row number with the number of rows in the range is as follows.
=MIN(ROW(A4:C18))+ROWS(A4:C18)-1We need to subtract 1 from the total number of rows to ensure that the row number we get using the formula points to the last row of the range, not the row after it.
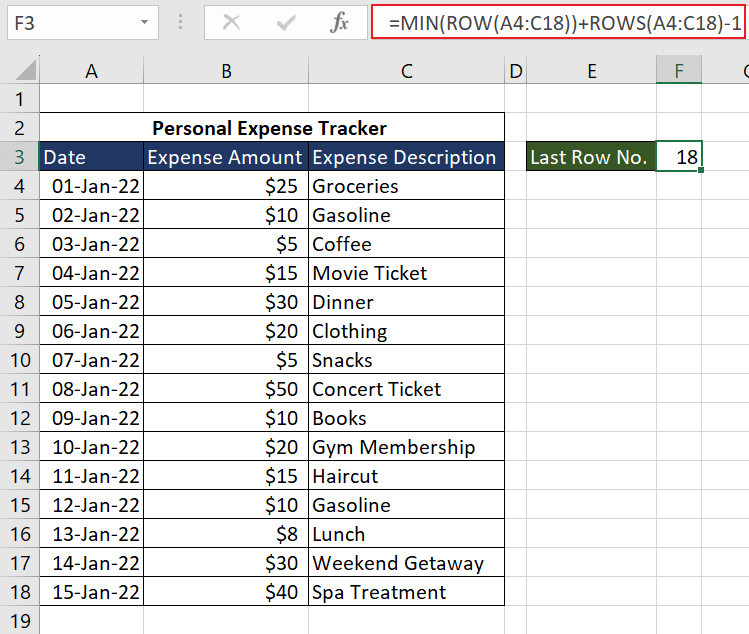
This trick is really helpful when dealing with large datasets as we can easily get the last row number and then use that to set the cell range accordingly. Using the ROWS function, we now know how to count the total rows in a given range. How to find the total cells in a given range?
Example 4 – Calculating Total Cells in Range Using ROWS Function
Suppose we have a dataset of all the students that are enrolled in the school from Class 1 to 3. We simply want to know the total number of students enrolled in the school. Ideally, the total cells in the range should indicate the total number of students and we can easily find this information in the status bar at the bottom of the spreadsheet program. However, using the ROWS function, we can get the value in a cell and then further use it for a calculation.
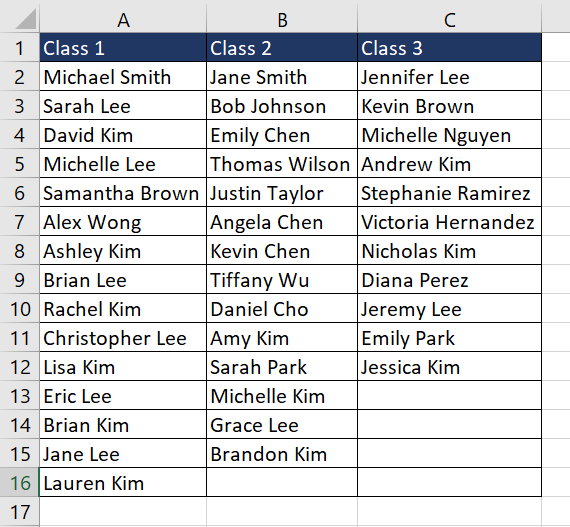
To calculate the total cells in the range A2:C16, we can multiply the total number of rows and columns. The formula used will be as follows.
=ROWS(A2:C16)*COLUMNS(A2:C16)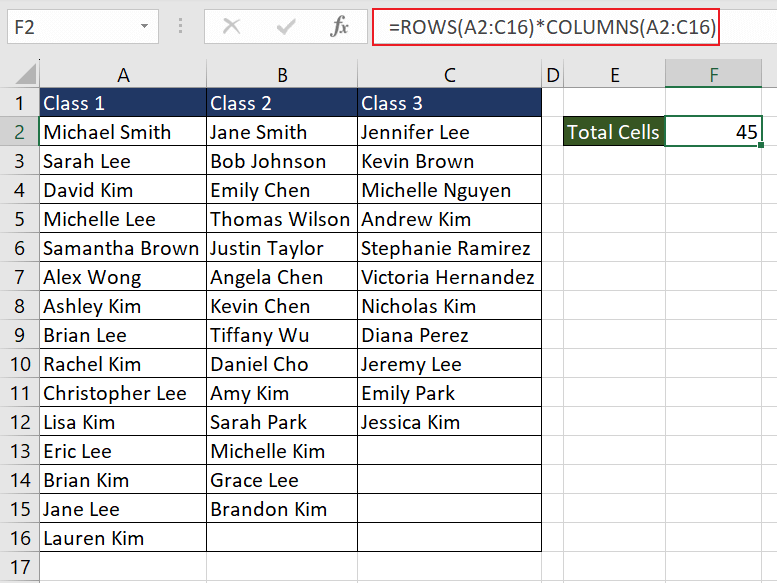
As there are 15 rows and 3 columns, the combination of COLUMNS and ROWS functions calculates the total cells in the range. Unfortunately, it also includes empty cells. To ensure that it only counts the cells that are not blank, we can use the COUNTBLANK function.
It will count the blank cells and then subtract them from the total cells. The updated formula will be as follows.
=ROWS(A2:C16)*COLUMNS(A2:C16)-COUNTBLANK(A2:C16)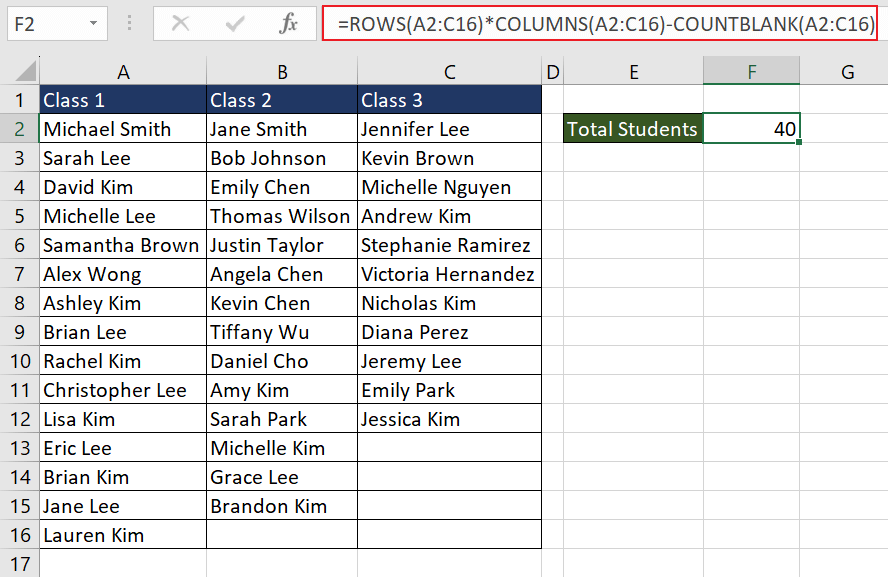
Now you know the total number of students enrolled in the school from Classes 1 to 3. Try to customize the formula to suit your needs.
Example 5 – Data Validation with ROWS Function
As the ROWS function counts the total number of rows, it's an excellent function to combine with the Data Validation Feature of Excel. Suppose we have a workshop registration form, where participants can choose up to 5 workshops.
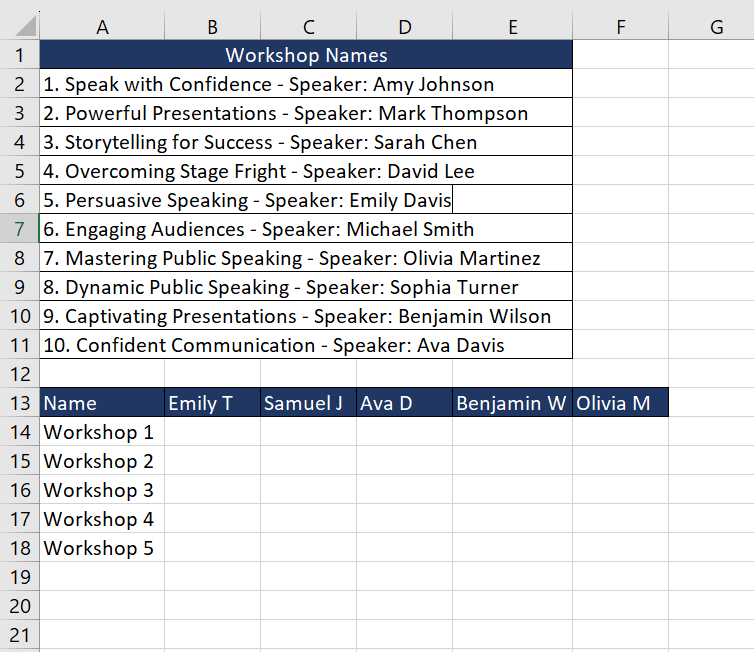
To ensure that no participant selects more than 5 workshops, we can use Data Validation along with the ROWS function. To apply that, select the cell range where users will enter the workshops.
Then, go to the Data tab in Excel and click on Data Validation from the Data Tools group.
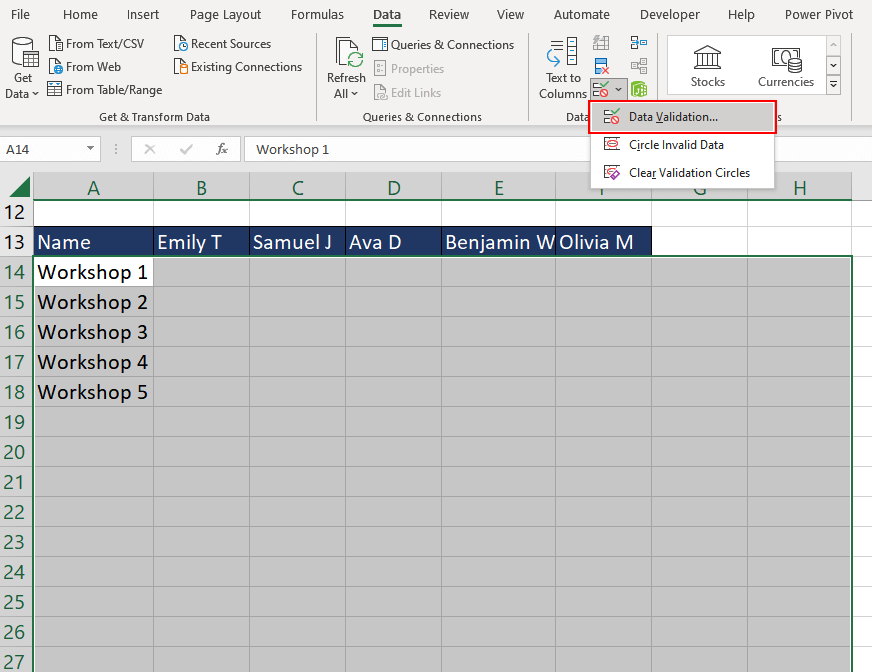
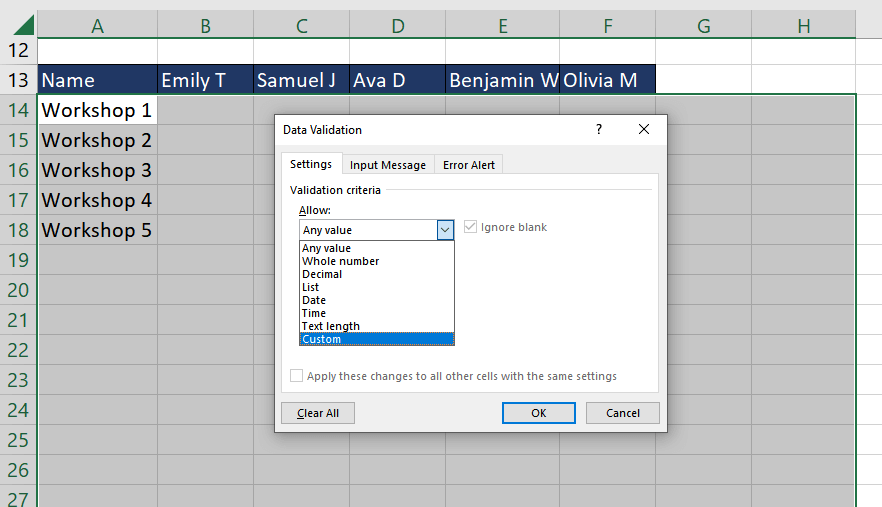
When a dialog box appears, under the Settings tab, choose Custom from the Allow drop-down list.
The next step is to enter the following formula in the Formula field.
=ROWS($A$13:H31)<=5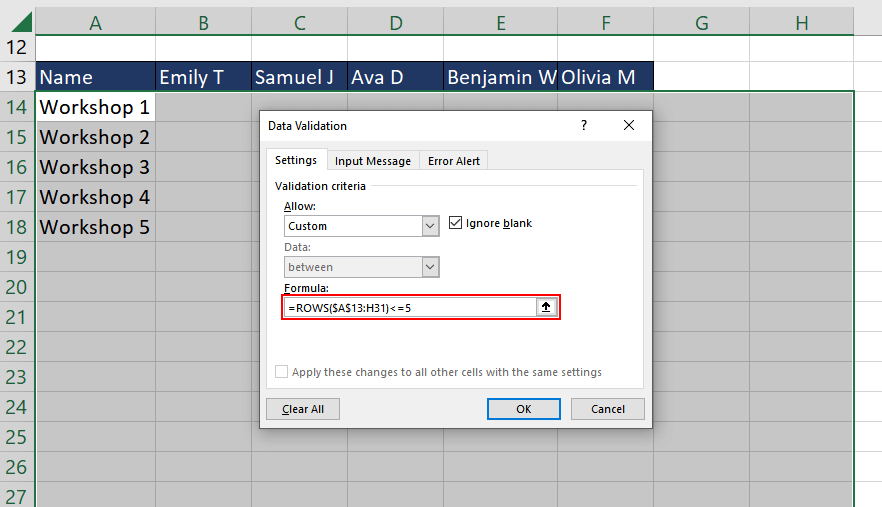
Finally, click OK to apply the Data Validation. This formula will count the total rows in the selected cell range and will limit it to 5. If any user tries to enter more than 5 workshops, Excel will display an error message.
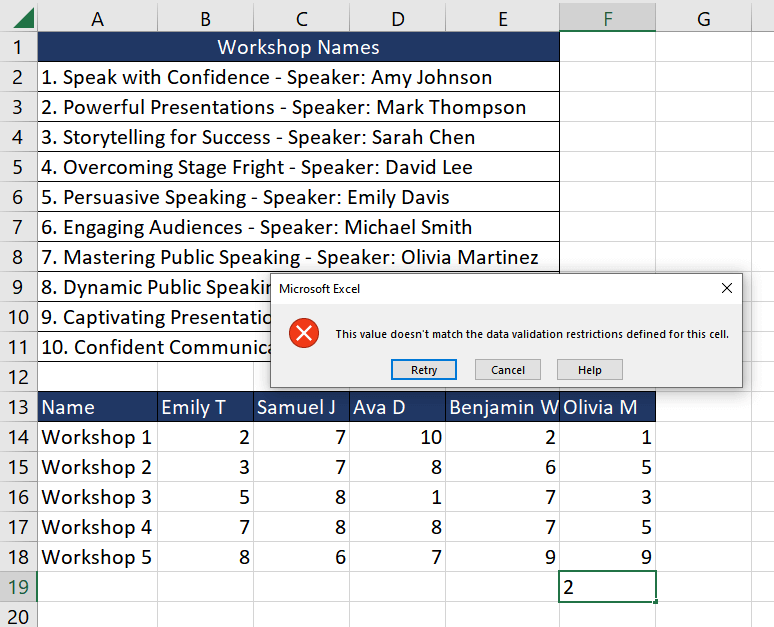
When the user attempts to enter data in cell F19 which is the 6th entry in that column, Excel gives an error.
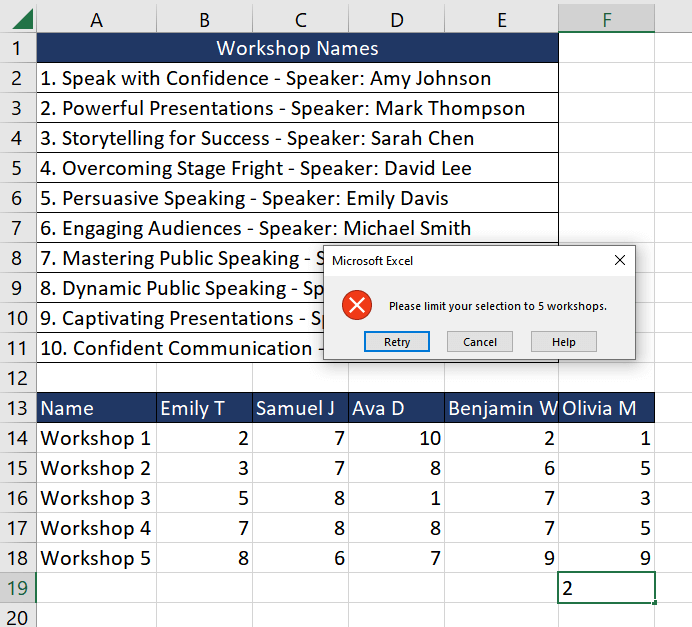
We can also configure a specific error message to suit our requirements. Select the Error Alert tab and enter a custom error message.
ROWS Function vs COLUMNS Function
Now we know that the ROWS function helps us to calculate the total number of rows in a given cell range or array. On the contrary, the COLUMNS function determines the total number of columns in a given range of cells.
Let's take a look at a simple example for better understanding. Here we have the calendar for January 2023.
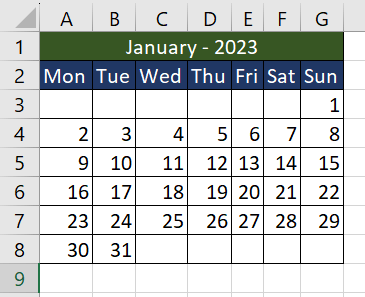
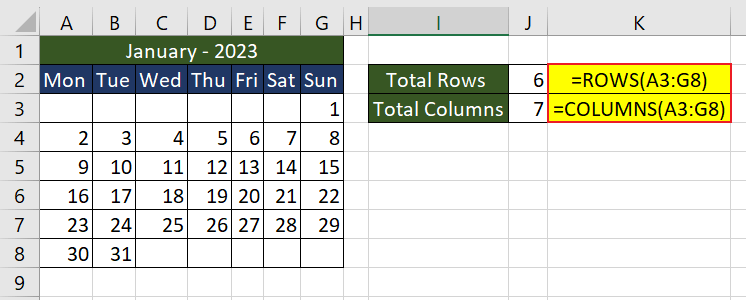
Using the ROWS function, we can calculate the total number of weeks (depending on the input array) while the COLUMNS function will give us the days in a week. The formulas used will be as follows.
=ROWS(A3:G8)
=COLUMNS(A3:G8)
If we exclude the names of the days of the week and calculate the total number of rows and columns in the array A3:G8, we will get the following return values.
Both functions are very useful when dealing with large datasets and when combined with other Excel functions, they can be incredibly valuable tools.
ROWS Function vs ROW Function
As the name suggests, both the ROWS and ROW functions return data related to rows in the worksheet. The ROWS function counts the total number of rows in a given cell range whereas the ROW function returns the row number of a given cell or cell range. Let's understand it using an example.
Here we have a sample dataset in the cell range A1:C5, where we will use both functions to understand the contrast better.
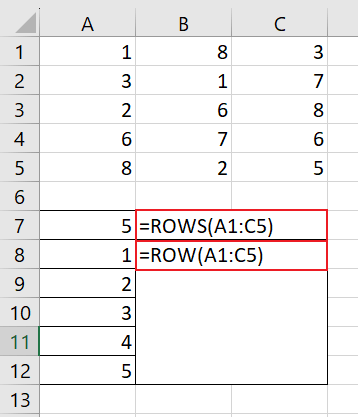
The formula used will be as follows.
=ROWS(A1:C5)
=ROW(A1:C5)
In the first case, the ROWS function counts the total number of rows in the given cell range and returns 5 indicating rows 1,2,3,4, and 5. In the second case, the ROW function retrieves the row number of the specified cell range and spills the result in cell range A8:A12.
As the names of these functions are pretty similar, it's vital to grasp their distinct functionalities to use them accurately in Excel.
Practice the ROWS function to explore more applications and use it to improve your data analysis capabilities. Stay tuned for more exciting Excel functions to further enrich your toolkit and add another one to your arsenal.


