We all know how averages work, right? Means or averages are easily calculable and represent a central value. That's all fine for regular numbers but the more factors you add, the average value starts seeming a bit misrepresentative.
This can be resolved by associating some quantitative data to each number that will work as weights. Their inclusion in calculating an average gives more weightage to the numbers, slightly shifting the final value from the central value towards the weighted values.
With a bit more demonstration, you will master the weighted average in no time. This tutorial will give you a full picture of weighted averages. What a weighted average really is, how it differs from the average we all know, and how to calculate it. Let’s see what this is all about.

What is Weighted Average?
Weighted average or mean calculates the average of numbers in a dataset by multiplying the numbers to their respective weights. The weights signify the importance or probability of the numbers and therefore, a weighted average delivers a more accurate average. If all the numbers held equal weight or importance, the average of those numbers would equal their weighted average.
A weighted average is calculated by summation of the weights multiplied by the numbers. This value is then divided by the sum of the weights. The syntax for the weighted average is as follows:
Weighted Average = (number1 x weight1) + (number2 x weight2) + ……. / sum of weightsMethod #1 – Using SUM Function
Calculating a weighted average does require summation and nothing does summing better than the SUM function. The basic of them all, SUM function adds all the numbers in a range of cells. For calculating a weighted average, the SUM function can help us by adding the product of the numbers and weights for the numerator and for adding the weights in the denominator.
Let's move on to the formula for calculating the weighted average using the SUM function:
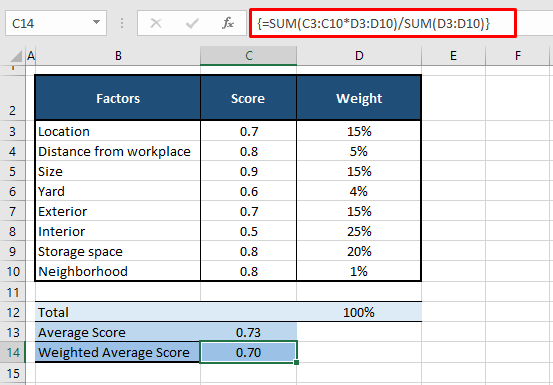
=SUM(C3:C10*D3:D10)/SUM(D3:D10)Let’s understand the scenario first. Suppose we’re house-hunting. We have a few options and need help deciding so we’ve stacked up a list of factors and scored the houses out of 10 on those factors. For easiness’ sake, instead of writing e.g. 7/10, we’ll write the score as 0.7. We’ve also added weights to those factors according to how much each factor is important to us in a house.
An example of the rating of one house is shown below with the scores in column C and the related weights in column D. Using the SUM function, we have multiplied the scores in C3:C10 by the weights in D3:D10. The outcome will be divided by the sum of the weights in D3:D10 and we arrive at our weighted average score of 0.70.

Now if you look at the average score, which is calculated by applying the AVERAGE function on C3:C10, we can see that this house scores 0.73 or 7.3 out of 10. If we then consider the weights, the factors with lower weightage have pretty high scores and the most important factor, the interior has the least score. Therefore, the weighted average is a truer reflection of the average as it takes into account the importance of each value included in the calculation of the average.
Method #2 – Using SUMPRODUCT Function
The SUM function was easy to understand and familiar. Weighted averages can also be calculated with the SUMPRODUCT function which also offers a very simple formula. The SUMPRODUCT function returns the sum of the products of corresponding ranges. Let’s have a look at the formula and calculate the weighted average:
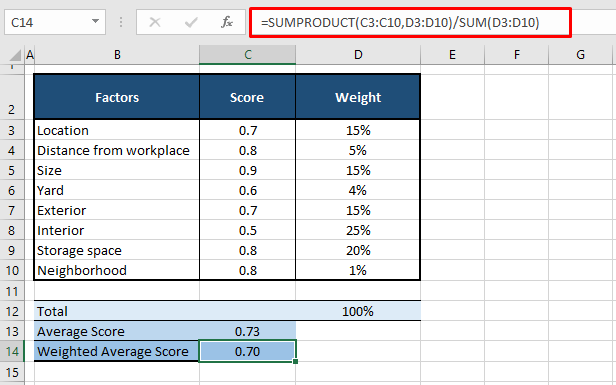
=SUMPRODUCT(C3:C10,D3:D10)/SUM(D3:D10)The formula is very similar to the previous one we used but for multiplying column C with D, we have incorporated the SUMPRODUCT function. SUMPRODUCT multiplies one by one the values in C3:C10 with the corresponding values in D3:D10 (0.7 x 15%, 0.8 x 5%…..).
In the second part of the formula, the sum of the products is divided by the total weights. The total is performed using the SUM function. The final figure we get is the weighted average score of 0.7. This result is consistent with the one of SUM function so we know we’re on the right track.

The weights in this example equal 100%. However, this is not necessary for the calculation, you will still arrive at a weighted average if the weights do not add up to 100%. The formula also doesn’t require the weights in percentages. See another example below to find out how to work with non-percentage weights.
Weights not as Percentages
It’s not important for the weights to be in percentages. Our weights in the next example are quantitative data. Using the SUMPRODUCT function we will calculate the weighted average in an identical manner. This is the formula:
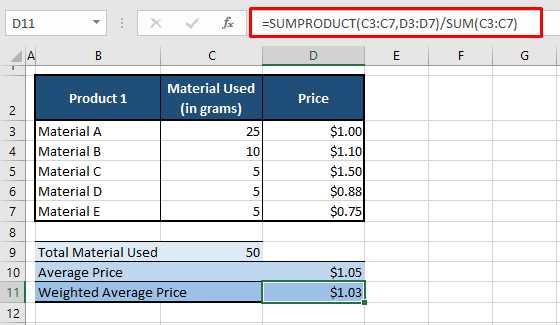
=SUMPRODUCT(C3:C7,D3:D7)/SUM(C3:C7)In this example case, we have a product i.e. Product 1 of 50 grams made up of 5 materials of varying prices. The quantities of the 5 materials in Product 1 are listed below. To find out on average, the price of each material that goes into the finished product, we’ve calculated a weighted average price.
The SUMPRODUCT function calculates the total of the column C values multiplied by the respective column D values. This amount is denominated by the total of the materials used, mentioned in C3:C7, using the SUM function. The final outcome is the weighted average price of $1.03 which differs from the arithmetic mean of $1.05.

Average vs Weighted Average
An average is the central value in a dataset and is calculated by dividing the sum of the numbers by the number of the numbers. From the formula shown above, we can conclude that there is no weightage involved. Let’s talk about the difference in concept of the two averages without the numbers first.
The most common example of a weighted average, one you may have encountered yourself is that of grading in a semester. Let's say that students' performance will be assessed based on their marks on a class test, assignment, mock exam, and final exam.
If a student does exceptionally well in the test and assignment, they wouldn't need to score well in the exam because the overall total would average out the performance. But if weights were assigned to each, giving more importance to the final exam, the students will take the exam seriously and their overall assessment would be better represented by a weighted average.
Just a while ago we said we were on the right track and we’ve finished already! See how easy that was? It might sound a little daunting but a weighted average is only a meaningful average, that is all and we have shown you two simple ways of calculating it.
It is our mission to take the trouble out of your Excel troubles and we’re going at it non-stop! See you on the other side of another Excel solution!


