Piles upon piles of data can quickly become overwhelming and Excel offers an equally quick solution to organize data and group it. Since deleting data can't be an option most of the time, grouping data allows you to choose which data you want to see and which you want to temporarily stow away.
In addition to that, you can hide all the hundreds of small detail entries and have the totals or subtotals of groups of data on display. This will aid in quick analysis as you can get categorized summaries or focus on the core areas.
The same treatment can be done to columns but today we are focusing on grouping rows in Excel and this tutorial is going to center around the Outline group from the Data tab. By the end of it, you will know how to group rows with simply an outline or also with summarized data.
An outline is the grouping mechanism added in the row header area and it can have up to 8 levels – levels being the subgrouping of the categories in the dataset. There's a stream of stuff to learn so out with the oars and…
Row row row your groups! (Group group group your rows to be more specific.)

Method #1 – Using Group Feature
What better to group rows in Excel than the Group feature. The Group feature groups rows or columns, clubbing the rows/columns of the selected cells so that they can be expanded or collapsed as a group. Used once, the Group feature bunches the selection into a single group. The implication is that every group will have to be made individually.
Conceptually, the reason you would want to group rows is to bunch up certain categories together. For that, optimally, the data should be sorted or arranged so the Group feature can appropriately club them together.
With the following steps, you will be able to use the Group feature to group rows in Excel:
- Select the cells of the rows in the datasets that you want to group.
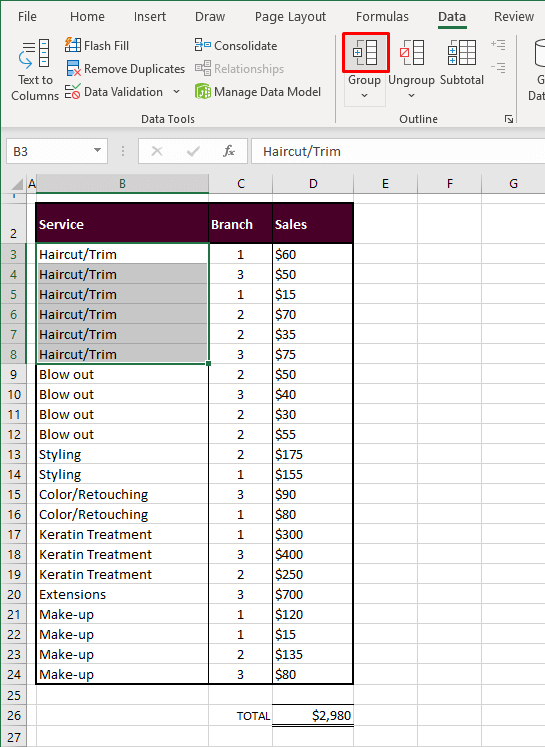
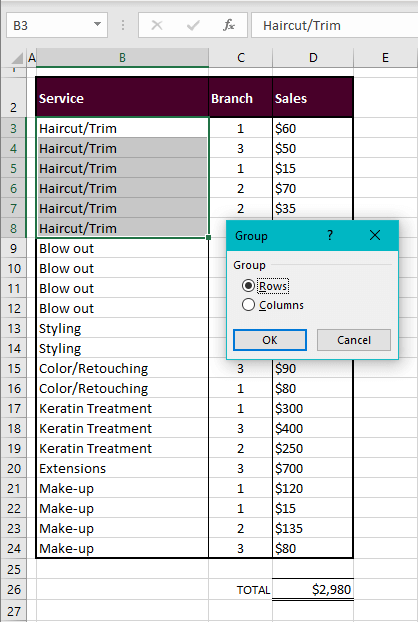
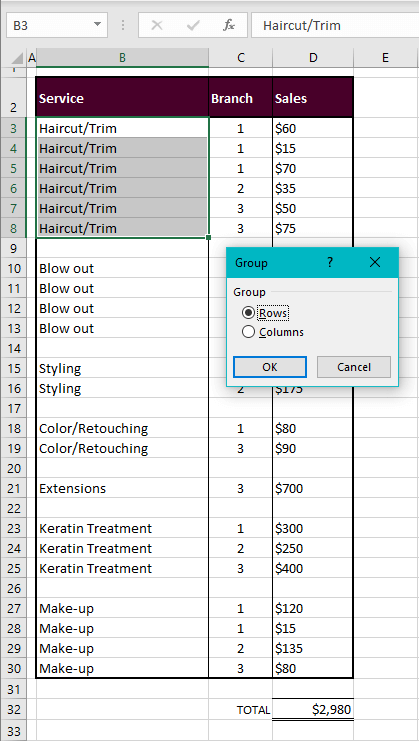
- In the case example shown below, we are aiming to group rows 3 to 8 to club the Haircut/Trim category together. We don't need to select B3 to D8 for that; we can select the rows from any one column.
- To create the group, click on the Group button in the Data tab's Outline
- A small pop-up window will need you to confirm if you want to create the group for rows or columns.
- Make sure the Rows radio button is selected in the pop-up. Then click on the OK.
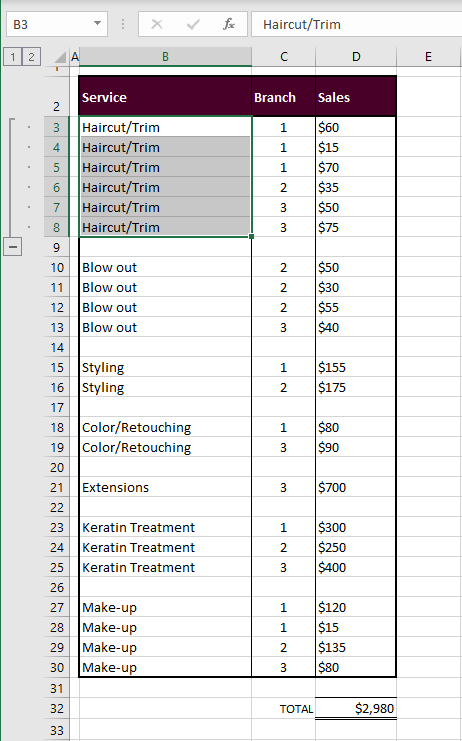
The rows of the selected cells will be grouped, and this is what it looks like:
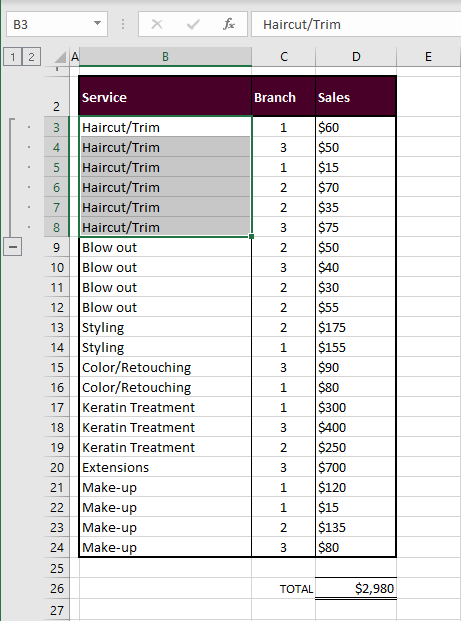
You can see the change in the row header area with a brace ending in a minus sign with numbers in boxes above it. This is what an outline refers to and it has no effect on the face of the dataset. The numbers denote the levels in the outline.
Here, we have created a 2-level outline with the first level being the Haircut/Trim category, and the second level being the detail rows of the group. As a group, an outline containing up to 8 levels can be created.
Note: There is no hard and fast rule to creating a group as it doesn't have to be made for a defined category. A group can be of any set of rows of your choice and is made based on whatever the cell selection is.
Collapsing and Expanding Grouped Rows
In the outline symbols, click on the minus sign of the group to collapse the rows.
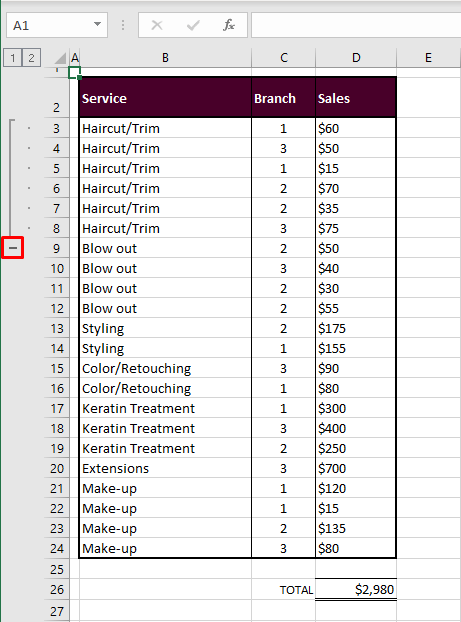
The minus sign has changed to a plus sign (that can be used to expand the column back).
The collapsed group hides the rows from the worksheet and the row numbering shows a wedge between rows 2 and 9.
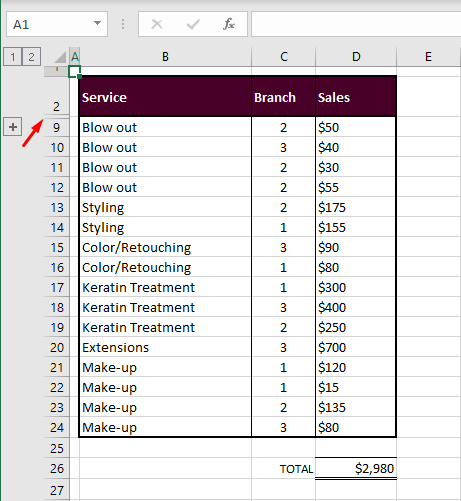
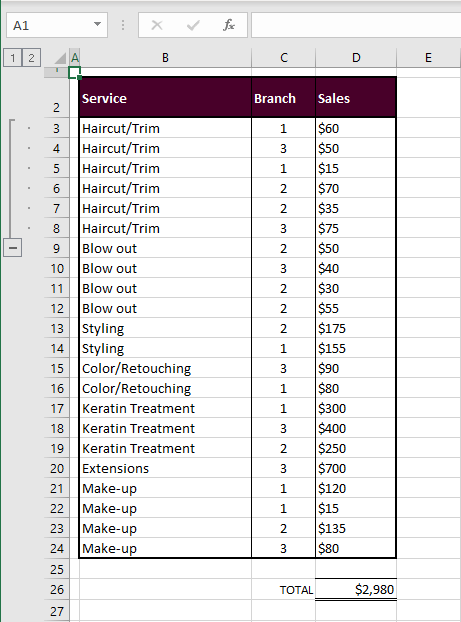
Use the plus sign to expand the rows again:
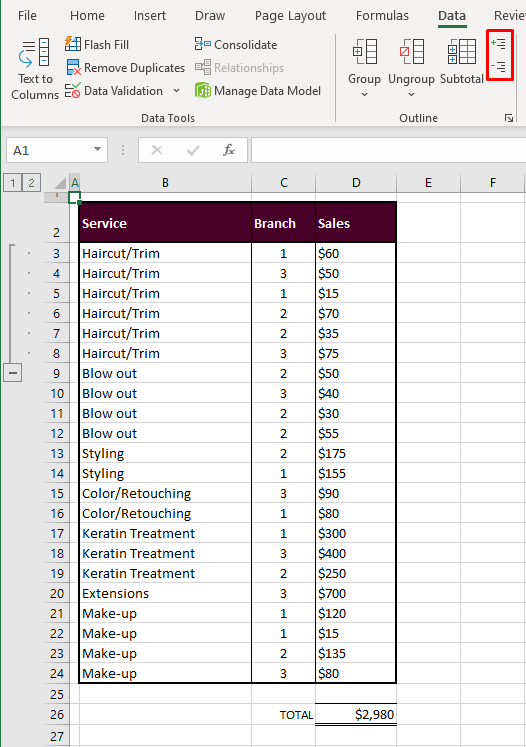
The Show Detail and Hide Detail buttons can be used to expand and collapse groups of rows. Select a cell from a group that you want to show or hide and use the Show Detail or Hide Detail button accordingly. This will also work for multiple cell selections and therefore multiple groups.
Creating More Groups
To create a group out of another set of rows, the same steps will have to be repeated after selecting the set of cells. Forming another group out of a range disjointed from the first one would be no issue.
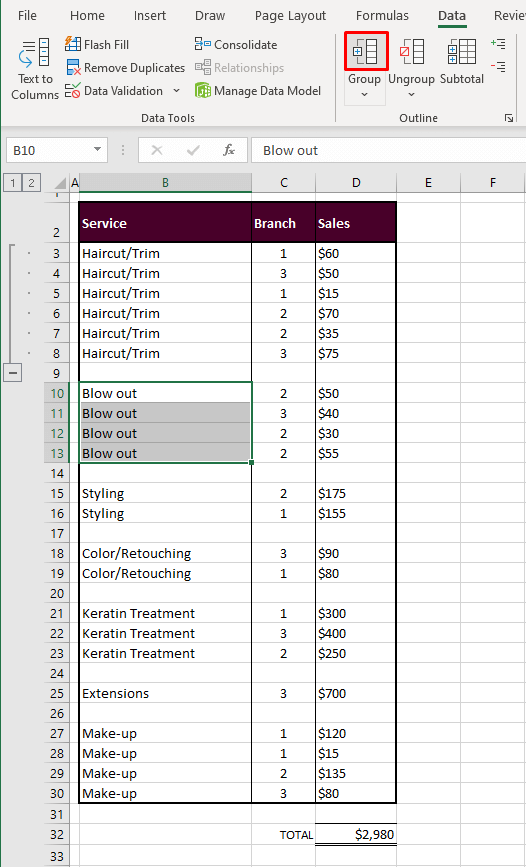
But if you are to make another group from a consecutive range (in our case example, that would be B3 to B9 with the next category i.e. Blow out), you will have to add an empty row between the categories otherwise the groups will fuse into one group.
After separating the categories with an empty row, follow these steps to create another group of rows:
- Select the range corresponding to the rows that will be grouped.
- Using our case example, the next group we want to create is of the rows with the details of the Blow out category. For that, we have selected B10 to B13. Also note that the categories have now been split with an empty row.
- Next, select the Group button in the Data
- Click on the OK button of the pop-up window after selecting the Rows
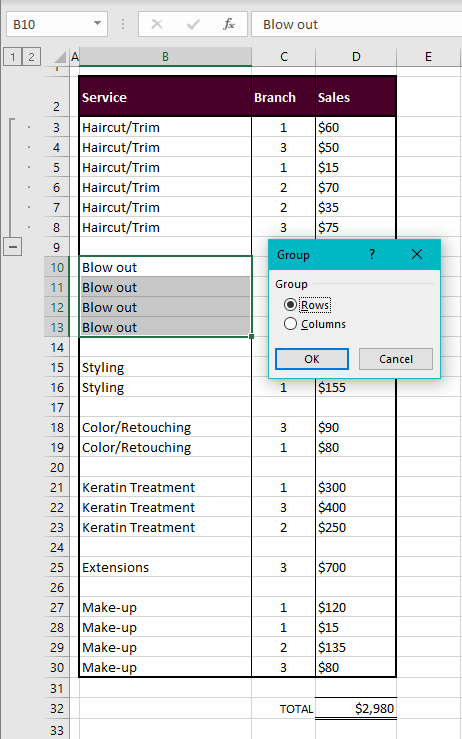
The next group will be formed:
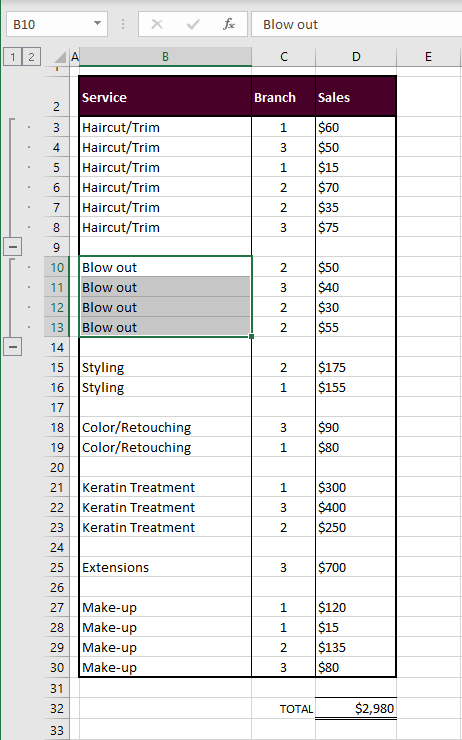
Similarly, you can great groups other sets of rows in the dataset, taking care that consecutive groups are separated by an empty row. However, each group will have to be made individually as the Group feature doesn't work on multiple selections. Use the Group feature for individual groups.
If you want all the categories grouped separately you should explore the other options in the Outline group under the Data tab. The other features are discussed ahead in this guide.
Adding More Levels in Outline
Adding more levels to the outline would mean clubbing together further subsets in the main sets of the rows which creates inner or nested levels. Outer levels can also be added by clubbing broader categories. It is as simple as forming any other group and depends upon the cell selection.
And, as mentioned earlier, you may find that the categories that you want to group need sorting or should be presorted.
It's okay if you have already started grouping. You can clear the groups with the Ungroup button (next to the Group button), sort all the categories, and then create groups.
As in our case example, using Sort & Filter, we have alphabetically sorted the Service column before arranging it and numerically sorted the Branch column.
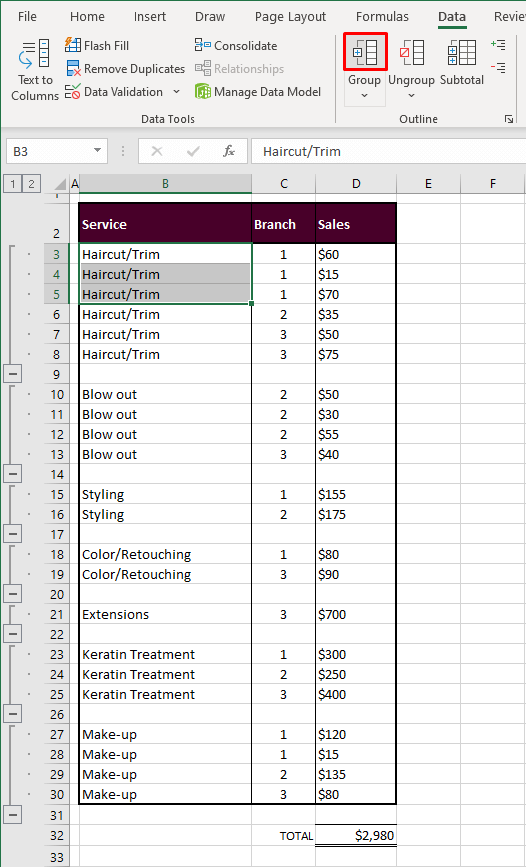
We have already added the groups for the Service categories so let's proceed with grouping a branch which will add an inner level in the outline.
- Select the cells of the subcategory that you aim to group.
- From the Data tab, use the Group button and then select the OK command in the pop-up window that confirms grouping for rows.
- From a 2-level outline, the grouping has changed to a 3-level outline with the first level groups for the Service category, the second for the Branch subcategory, and the third for the detail rows.
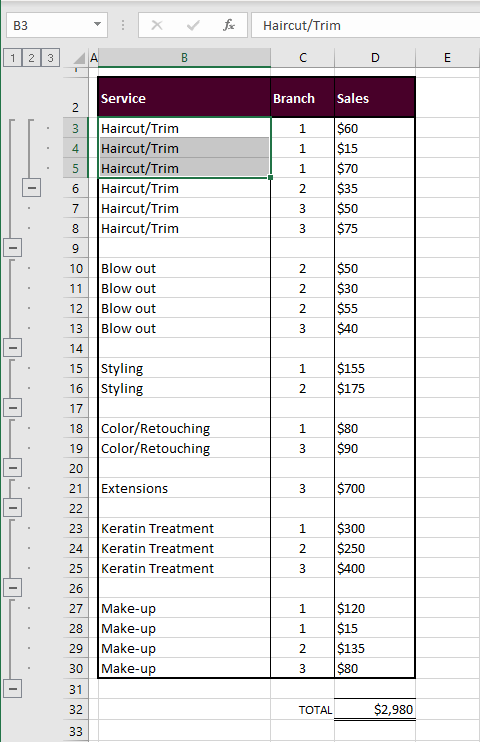
Groups don't just work in forward levels but also in backward levels and you can create a group of rows of a larger category. In our case, we can add a group of all the hair-related categories. Just select the relevant cells i.e. B3 to B25 for us, apply the Group feature and an outer level will be formed.
In the example shot ahead, we have made a group for the Make-up category too:
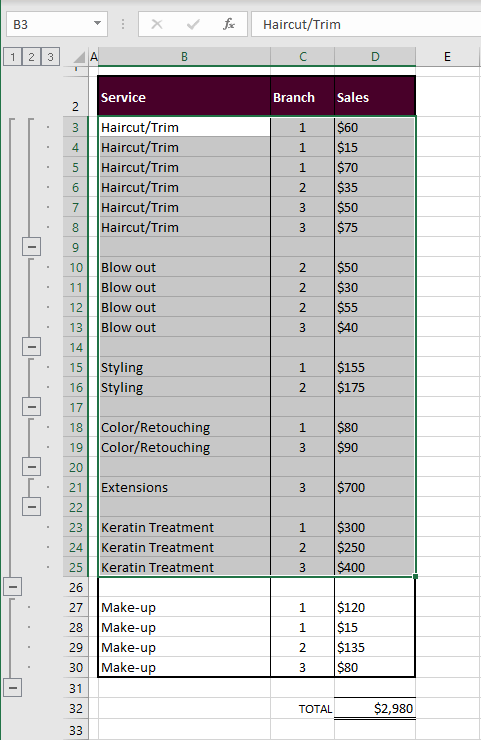
Note: To avoid incorrect grouping of the rows, make sure there are no hidden rows or data on the worksheet.
Method #2 – Using Keyboard Shortcut
The very same Group feature can be applied using a keyboard shortcut instead of using the Group button on the Ribbon. Have the cells of the target rows selected and the keyboard shortcut will form the group by leading you to the small pop-up window. The complete keyboard shortcut is:
Shift + Alt + Right arrow + Enter
Shift + Alt + Right arrow keys will apply the Group feature and pop open the Group dialog box.
Enter key will select the OK button in the dialog box (given that the Rows option is selected by default).
Create a group of rows with this keyboard shortcut using the steps ahead:
- From the dataset, select the cells to be grouped.
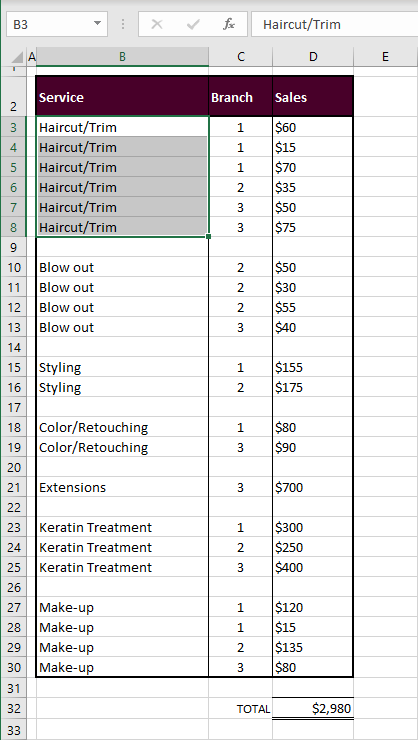
- We are selecting B3 to B8 to group the Haircut/Trim category.
- Use this keyboard shortcut to trigger the Group feature: Shift + Alt + Right arrow keys
- The Group pop-up window will appear.
- Press the Enter key after confirming that the Rows option is selected.
Now the Group feature will be applied completely and will club together the rows of the selected cells:
Method #3 – Using Auto Outline Feature
Adding groups of rows manually is the smart way if you only require a few of them. Suppose you want the whole dataset or a significant consecutive part of the dataset bunched for the respective categories, you can opt for the Auto Outline feature. But with a condition.
Auto Outline requires summary rows (e.g. totals or averages of the bunch that you want grouped) to pick up on the data and form the outline. This means that Auto Outline won't be able to work unless the intended groups have been split by adding an extra row with some form of a calculated summary of the group in that row.
The Auto Outline feature does not affect the dataset itself, it only adds the outline of the groups in the row header area (which, you will see later, is different from the Subtotal feature). See the steps to use Auto Outline using our case example where we have added rows at the point we want the groups to break and have also added subtotals in those rows within the Sales column.
The subtotals have been added using the SUM function and also boldened. Then you can proceed with the steps below to group the rows with Auto Outline in Excel:
- Select any cell in the dataset.
- This step applies to adding an outline to the whole dataset. If you're using Auto Outline for a part of the dataset, let's say we only want to leave out the Make-up category, select the cells with the figures including the subtotals i.e. D3 to D26.
- Go to the Data tab's Outline group and select Auto Outline option after clicking on the Group button's arrow.
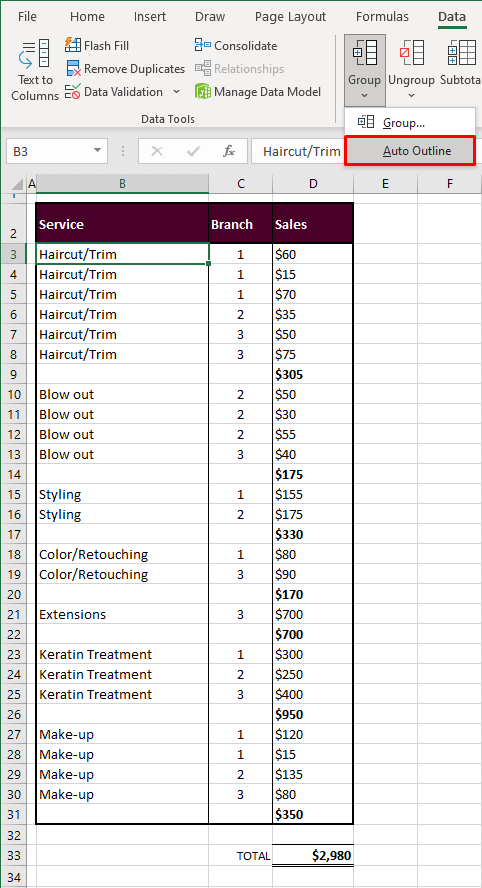
The Auto Outline feature will use the summary rows to create the groups and add an outline to the selected parts of the dataset:
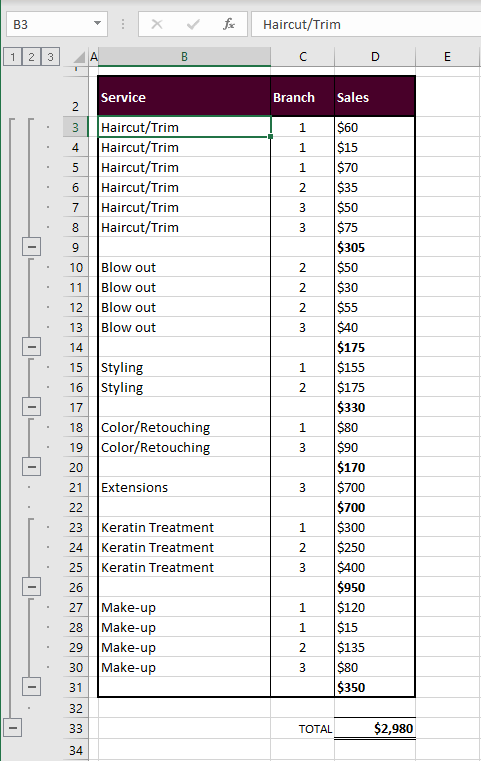
Auto Outline has retained all the formats of our dataset, but can you spot the anomaly? The Extensions category in our case example hasn't been grouped as it is a single detail row category.
No worries, the major work has been done by Auto Outline and a group can individually be created for the Extensions category using the steps from either of the previous 2 sections.
To remove the outline, select any cell within the groups and then click on the arrow under the Ungroup button and select Clear Outline.
Method #4 – Using the Subtotal Feature
The Subtotal feature requires very little from you to quickly return calculated rows of subtotals and totals. You will not need to insert any subtotals or empty rows manually for Subtotal's understanding.
Just have valid column headers (which should already be a part of the dataset) and use Sort & Filter to arrange the related data together so that classified grouping and totaling are ready for Subtotal to work with.
The Subtotal will automatically add extra rows containing the subtotals and the grand total, shifting downward any data below the dataset. The basis for calculating subtotals can be set and will be returned in the set column with the name of the calculated rows in bold font.
Another easy characteristic of Subtotal is that it can be applied to any selected part of the dataset if you don't want the whole dataset covered. With the steps below, you will be able to use the Subtotal feature for the full dataset to group rows in Excel:
- Select a cell in the dataset to use the Subtotal feature on the whole dataset.
- Otherwise, select the preferred part of the dataset to apply the feature there.
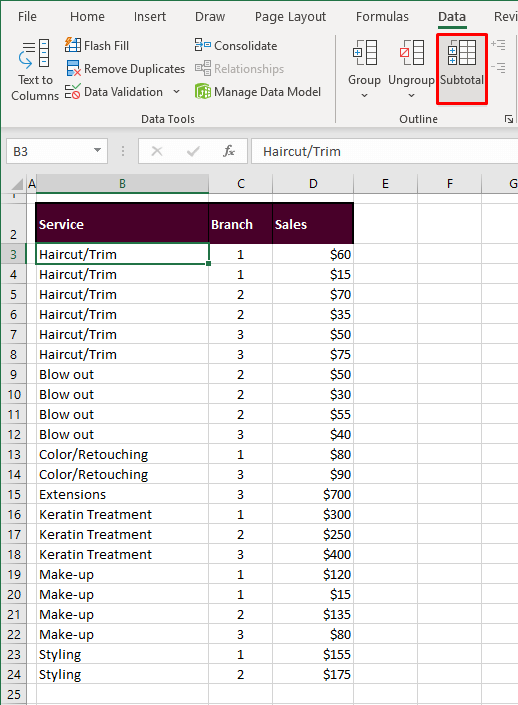
- Click on the Subtotal button in the Data
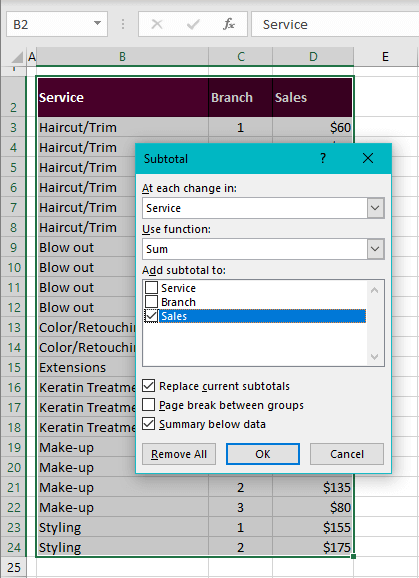
- You will be redirected to a Subtotal dialog box while the whole dataset is selected in the background. This way you'll know that Subtotal has picked up on the indication and will apply the feature to the complete dataset.
- Select the header in the At each change in section to set the basis of the row groups.
- Since we want groups of the Haircut/Trim, Blow out, etc. categories, we have selected the Service header here. Use function by default is set to Sum which we need for the subtotals but there are other options for the summary rows in this section. The subtotals are to be added in the Sales column which is the selected option in the Add subtotal to section.
- Leave the other two boxes at the bottom of the dialog box checked.
- When you're done, hit the OK
An outline will be added along with changes to the dataset. Now the dataset includes a grand total row and subtotal rows for every group.
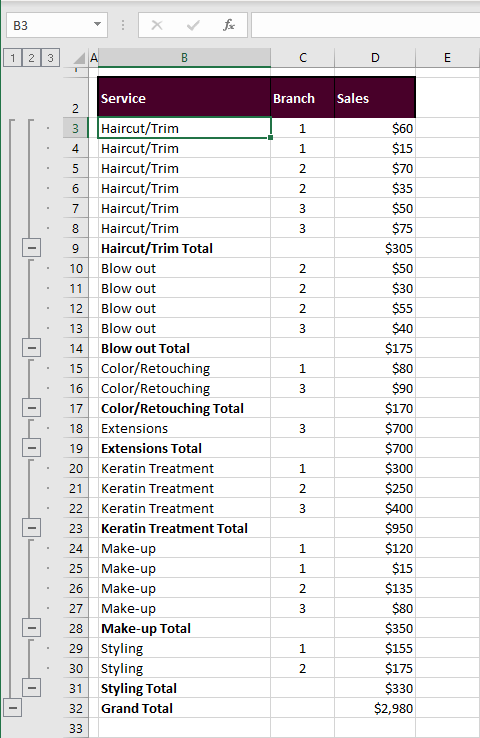
Good to see that the single detail row groups also aren't left out this time.
Expanding and Collapsing Groups from Outline
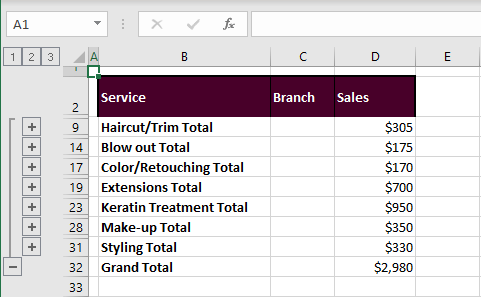
With a single click, you can expand the dataset or collapse it into just the summary rows. Click on the level number in the outline to collapse the data with only the subtotals displayed. That's level 2 in our example outline:
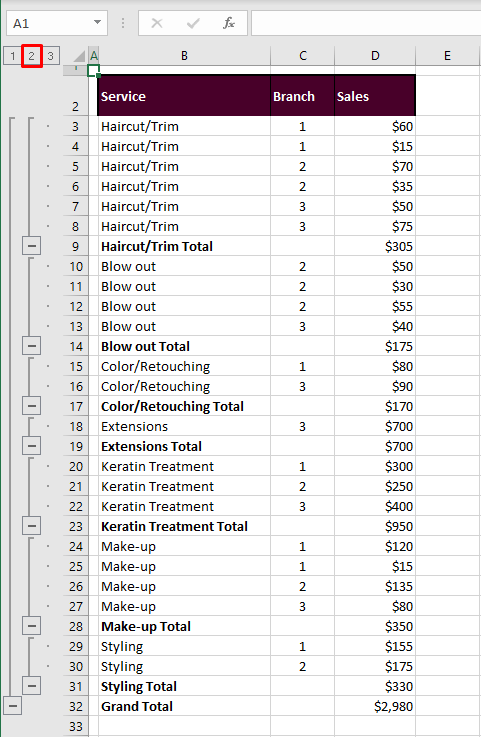
All the summary rows will be in view:
Click on the last level of the outline to expand the dataset back to the detail rows (i.e. level 3 for us).
You can use these level buttons to expand or collapse the groups. For specific groups, you can make use of the Hide Detail button. Let us show you how. Let's say we want all other than the upper 3 groups collapsed. Select the remaining dataset and click on the Hide Detail button in the Outline group of the Data tab.
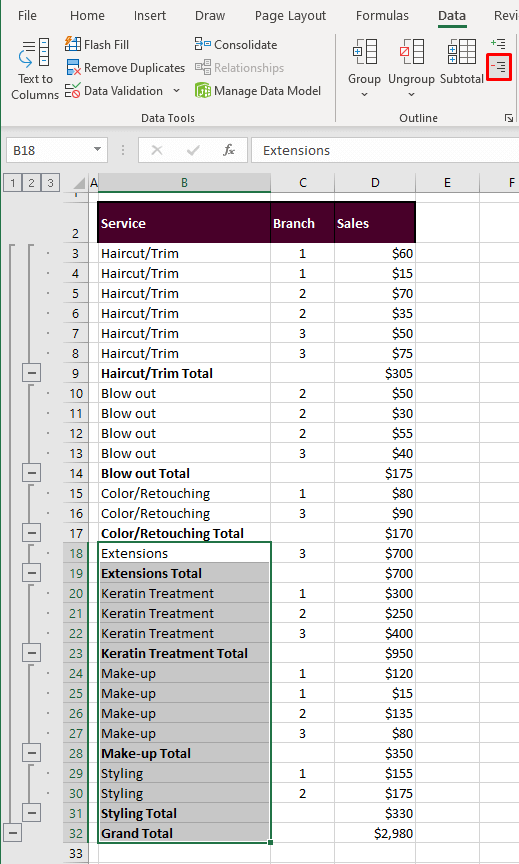
The selected area of the dataset will be collapsed with its rows:
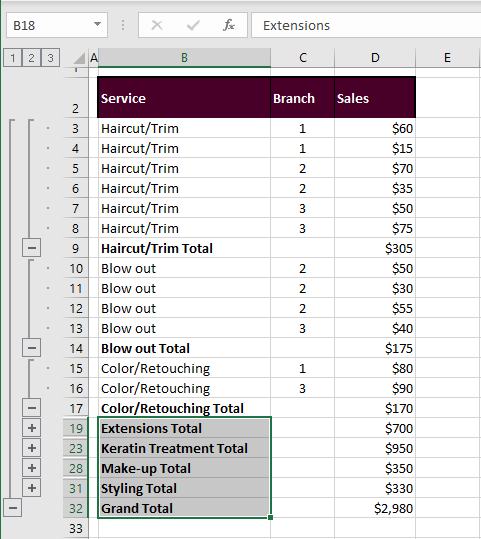
You can use the Show Detail button anytime to expand some or all of the collapsed groups again.
If you've practiced the methods, you should be an expert row grouper by now. We'll tag you with a row grouping badge. You've earned it! And with every lesson, you get closer to being Excel experts. We'll be back with more time-saving, troubleshooting, and Excel tooting. We'll sign off with the hope that your badge collection is growing.
