Have you ever questioned how good or bad your exam went or felt that the examiner was biased against you? Sometimes you get just a good grade even though your exam went stellar and sometimes you did alright but got the result even worse. There’s a good chance that you were graded using the percentile system which varies from the percentage system and consequently, the results may vary.
Keeping the woes and joys of percentile aside, today’s tutorial is on calculating percentile in Excel using the PERCENTILE, PERCENTILE.INC and PERCENTILE.EXC functions.
If this is your first time understanding percentiles, we will get into what it is and how it’s different from percentage. Sounds like a deal?
Let’s get percentiling!

What is Percentile
Geek way, the percentile is a measure in statistics that shows what percentage of scores fall under a certain score in a frequency distribution. A (let’s say) 90th percentile is a value that has 90% of the values from the distribution below it and 10% values from the same distribution above it.
Now to make this easier to comprehend, we can talk about the definition in terms of marks scored in an exam which also banks the most common usage of percentile.
Newbie way, percentile compares a score to other scores in a data set. We can also say that percentile tells us the position or rank of a score in a set of scores.
E.g. In a class of 10 students, 9 students score 70 marks and 1 student scores the full 100 marks in a test, you can very easily tell that 90% of the students have 70 marks. So, when the 90th percentile computes to 73 marks, it is deducible that 90% of the students have scored below 73 marks.
Percentile is a good way to compare scores in the distribution because the greatest score will become the 100th percentile and the other scores will be ranked according to the new 100%. Likewise, the lowest score will also become 0% instead of the actual 0 marks.
Here is the difference between inclusive and exclusive definitions:
- 90th percentile is the score below which 90% of the scores lie. – Exclusive
- 90th percentile is the score at or below which 90% of the scores lie. – Inclusive
It’s the same as the difference between less than and less than equal to. This is the statistical definition so do not confuse it with the inclusive and exclusive aspects of the functions in Excel.
90th is the percentile example that we just used above. This could be any number depending on the percentile you want to find. Other common mentions you may hear of are the first (25th percentile), second (50th percentile or median), and third (75th percentile) quartiles.
Percentile vs Percentage
Percentages we’re all familiar with but the point of discussing it here is to show you how they differ from percentile, other than the spelling. A percentage is a number expressed as a fraction of 100. Being a fraction of 100, a percentage can be expressed as a decimal too which also makes it easier to use in calculations.
It is however broadly denoted by %, the percent sign. A percentage represents a correlated part of a total. And while they can be individually compared, like percentile, they don’t have a ranked comparison. Keep reading.
A kth percentile (let’s again assume 90th) shows that 90% of the values fall below the calculated value. The value is expressed by the type of data the percentile is being calculated of. Height, weight, marks in a test, scores in a game; the calculated value will be denoted by the relevant unit of measure. The percentile itself is denoted by ordinals (90th, 50th, 2nd, 1st, etc).
Since the top value from the data becomes the 100th percentile, the other values can be ranked in comparison. Percentile ranking should be a topic of interest in this regard too. We’ll talk about that over a separate cup of Excel tea someday.
Let's take a small example that can clear everything. If a student gets 70% marks in an exam, the performance may seem alright. But if that was the highest score in the exam, seeing 70% on the grade card doesn’t look like an achievement at all if we go by percentage grading.
But if the percentile system is applied, then the highest score makes 100% while the others are ranked according to the new top score.
Now we should jot some numbers down in Excel to make the lesson more practical.
Example
The example we will use in this tutorial to demonstrate the use of the percentile functions in Excel:

What we have above is a list of students with the marks scored by them on a test of a total of 50 marks. If we are to express their marks on this test in percentage, here’s what we’ll get:
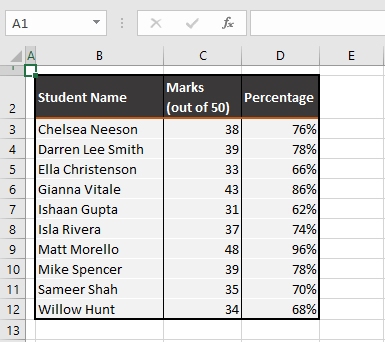
But this is not what we’re here for today, right? What this percentage calculation will show you is how percentile calculation differs from it. Setting some basic grounds here, the very obvious 50% score in this example would be 25 marks. Now you’ll see how the percentile functions in Excel will change these results.
Method #1 – Using PERCENTILE Function
You know we like to start with plain vanilla. No reason to change now; we’ll begin with the plain PERCENTILE function. Let k be the percentile you intend to find. For the 90th percentile, k will be 90.
The PERCENTILE function returns the kth percentile for a dataset. There you go, that’s it. This function was born for percentile-ing. Although the PERCENTILE.INC function has been introduced as a replacement function, the PERCENTILE function is still available (at least for now) for compatibility with Excel versions before 2010.
The following formula will show you how to use the PERCENTILE function to calculate the kth percentile marks using our example case:
=PERCENTILE(C3:C12,G3)In the first parameter, you need to select the range with the data for calculating the percentile. In this case, the range supplied to the function is C3:C12. To extend the formula, you can lock this range with the F4 key to create an absolute reference.
For the second parameter, type the percentage or cell reference of the percentile you want to calculate. E.g. for 50%, you can enter 0.5, 50%, or refer a cell that has one of these values. Effectively, only values between 0 and 1 can be used here. We have used G3 as the cell reference that contains “50%”.
The percentile will be calculated for the given data according to the entered percentage. See the result of the 50th percentile marks of the data given in the example case:
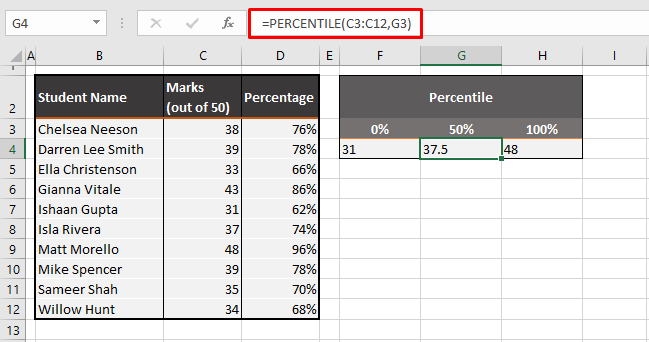
The 50th percentile falls on 37.5 marks. This indicates that 50% of the students in the data (i.e. 5 students) have scored below 37.5 marks and 50% of students have scored more than 37.5 marks. Our case example is quite small so if you’re curious, you can tally and confirm that only 5 students have scored below 37.5 marks.
0% lands at 31 marks which, if you notice is the lowest score in the data. Inversely, the 100th percentile is at 48 marks which is the highest score in the set. This is how the inclusive percentile works; the lowest and highest values of the distribution make the top and bottom percentiles. Individually, 31 marks make 62% and 48 marks make 96% if we go by the percentage system.
This is why you would wish for the percentile to drop if you had a tough exam because if no one was able to score very high, the highest achieved mark would become 100% and the rest of the marks would be ranked accordingly.
Method #2 – Using PERCENTILE.INC Function
Mentioned earlier, we told you that the PERCENTILE.INC function has been introduced as a replacement for the PERCENTILE function. Therefore it is no different from the PERCENTILE function. The replacement had actually taken place to branch out the one function into its two branches, inclusive and exclusive.
That is why we’ll be using the same definition to understand the PERCENTILE.INC function – it results in the kth percentile where k needs to be in the range 0 – 1 (or 0% to 100%) inclusively.
The formula used here for calculating the 50th percentile with the PERCENTILE.INC function is the same as the one used earlier:
=PERCENTILE.INC(C3:C12,G3)We’re using the same range C3:C12 with the marks. And for adding k in the second parameter of the function, we’re taking the value in G3 i.e. 50%. This way you can change the value in G3 to get the target percentile (e.g. 25th or 75th percentile).
The 50% percentile has been computed as 37.5.
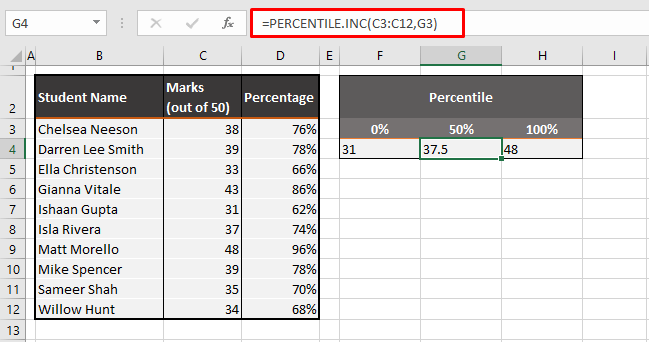
Note that the percentiles calculated by the PERCENTILE.INC function and the PERCENTILE function are the same.
In its attributes, the two mentioned functions are identical as the PERCENTILE function only accounted for the inclusive aspect. Now let’s move on to the exclusive aspect and see what difference that makes to the percentile calculations.
Method #3 – Using PERCENTILE.EXC Function
When computing percentiles in Excel, you need to decide which method you want to adopt as percentiles can also be computed using the PERCENTILE.EXC function.
This function returns the given percentile for a dataset. This part is the same as the PERCENTILE.INC function. The part that is different is the exclusion of the values 0 and 1 as k.
Therefore, a value between 0 and 1 can be supplied as k in the formula.
We’ll take that literally and hit it dead center with this formula:
=PERCENTILE.EXC(C3:C12,G3)As done in the other two functions, we're taking the same range as the dataset i.e. C3:C12 and finding the central percentile (50th):
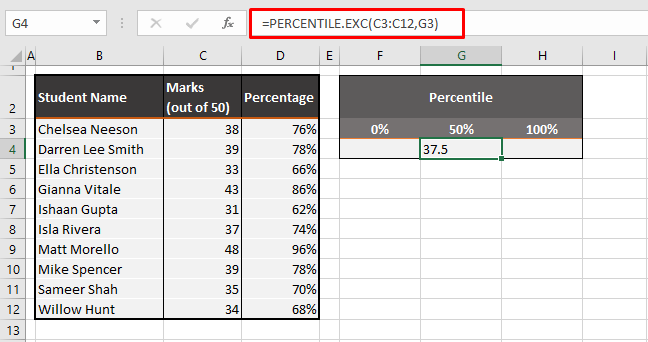
The PERCENTILE.EXC function returns the 50th percentile as 37.5 marks. Did you note how all three functions have resulted in the same 50th percentile?
Now let’s calculate the percentile using 0%:
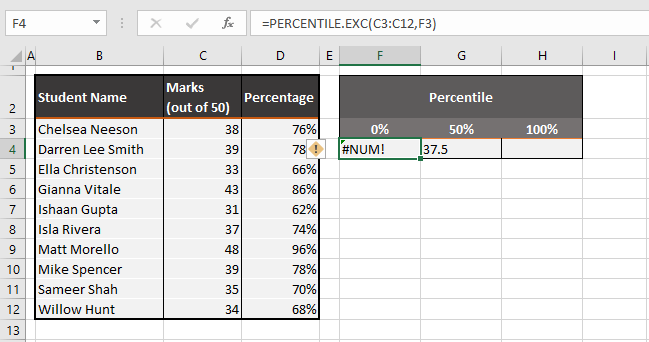
We got a #NUM! error and when we calculate the 100th percentile using the PERCENTILE.EXC function, we get:
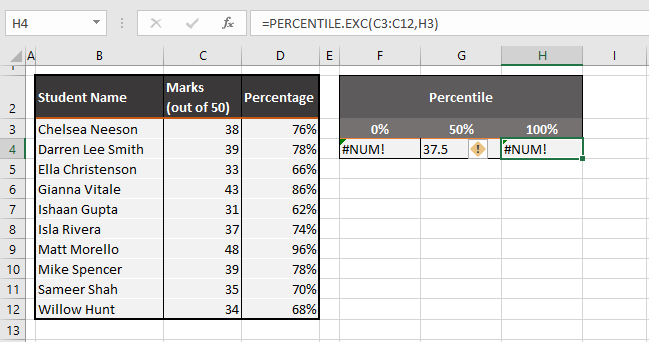
Another #NUM! error. As we said earlier, you cannot use 0 and 1 (or 0% and 100%) to calculate percentiles in the PERCENTILE.EXC function. This exclusion part of the function leaves out the top and bottom ends of the data.
You may now be wondering why would you use a function that doesn’t involve the top and tail of the data. It can be fair to use the PERCENTILE.EXC to exclude the end values as they may be a non-frequent occurrence.
If only one student has scored the highest marks and one student has scored the lowest marks, the PERCENTILE.EXC function can be used to get the percentiles where the occurrences in the data are denser.
Bear in mind, however, that since the top numbers are crunched downward, the bottom numbers in the distribution will also be crunched upward, increasing the upper percentile and dropping the lower percentile.
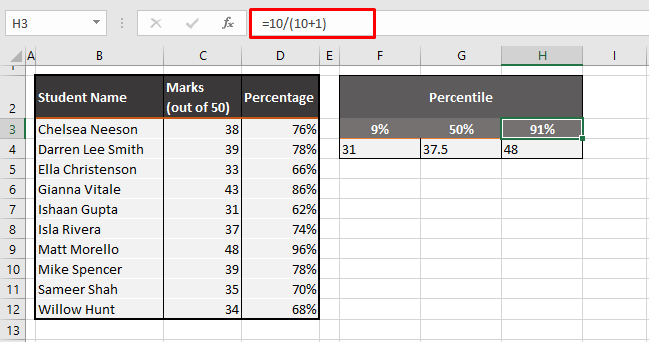
For now, we can only resort to calculating the 10th and 90th percentiles at most:
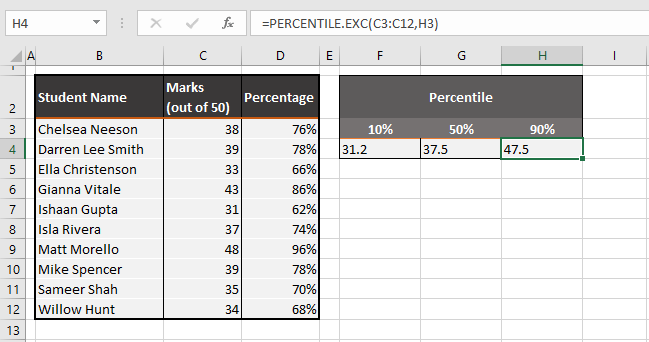
You may be thinking that since 0% and 100% are excluded, surely we can get the 1st and 99th percentile, right? Wrong. Not only does the PERCENTILE.EXC function excludes the 0% and 100%, but also extends that exclusion.
How much the function extends that exclusion depends on the number of values in the distribution. Our example has 10 values in number and we need at least 9 values to get the 90th and 10th percentiles. Similarly, you need 999 values to calculate the 99.9th and 0.1st percentiles.
Here’s an easy way to calculate the final percentiles (or the highest and lowest values of k) you can use according to the number of values in your data:
- Highest k: n/(n+1)
- Lowest k: 1/(n+1)
n is the number of values in the distribution. If k is not between these values, the function will return the #NUM! error. So let’s apply the borderline k values to our case example:
The formula we are using for the lowest k in our example:
=1/(10+1)This returns k as 0.09090909
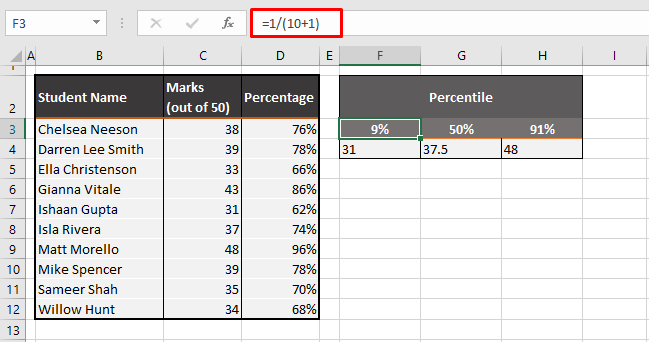
And we’ll use this formula for the highest value of k with 10 values in the distribution:
=10/(10+1)This will return the value 0.90909091
PERCENTILE.INC vs PERCENTILE.EXC
In most cases, it should be good enough to use PERCENTILE.INC. The prime difference between using the two functions is the range of k in the functions. In the PERCENTILE.INC function, the requirement for k is to be between 0 and 100 inclusively.
While this is also true for the PERCENTILE.EXC function, the additional exclusion is that of the top and bottom values as k.
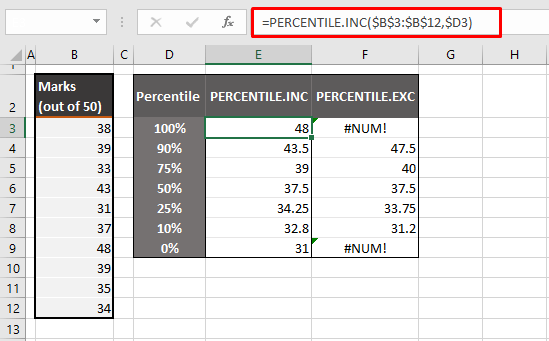
As you can see below, even the 91st and 9th percentiles are not calculable for 10 values in the dataset. with more values in the dataset, higher and lower percentiles will start becoming calculable.
The details of the maximum and minimum value of k that can be used in the PERCENTILE.EXC function has been discussed above. Whereas any percentile from 0% to 100% can be calculated using the PERCENTILE.INC function.
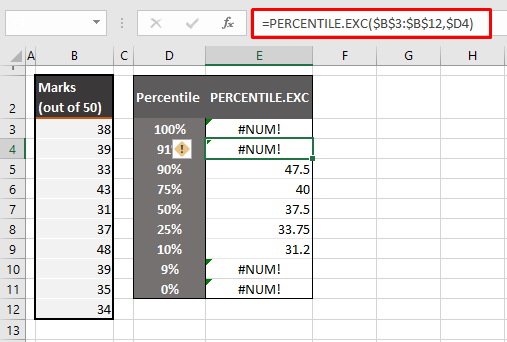
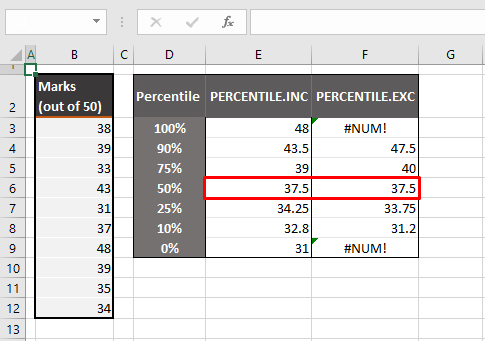
Comparing the resultant values of the two functions, note that the 50th percentile is the same in both. The other percentiles differ and spread out to compensate for the missing head and tail percentiles.
This is why you can see 48 marks as the 100th percentile in the PERCENTILE.INC function and a close 47.5 marks as the 90th percentile in the PERCENTILE.EXC function.
By now we’re ready to consider our brain tiled with percentiles and hope a good percent of your brain has absorbed today’s lesson. We talked about calculating percentiles and what the percentile functions in Excel are all about. There's also step 2 to percentile calculations if you want the percentages for each score as per the percentile system. We'll talk about that some other time. Until then, just Excel!


